Pipeline Tracing
In the Pipeline execution engine, we split the execution plan tree of each Instance into multiple small Pipeline Tasks and execute them under our custom Pipeline scheduler. Therefore, in an environment with a large number of Pipeline Tasks executing, how these Tasks are scheduled across threads and CPU cores is an important factor for execution performance. We have developed a specialised tool to observe the scheduling process on a particular query or time period, which we call "Pipeline Tracing".
Usage steps
1. Record Data
First we need to log the Pipeline scheduling process. Whether and how to log the scheduling process can be set via the HTTP interface. These settings are associated with a specific BE:
- Turn off Pipeline Tracing record
curl -X POST http://{be_host}:{http_port}/api/pipeline/tracing?type=disable
- Generate a record for each Query
curl -X POST http://{be_host}:{http_port}/api/pipeline/tracing?type=perquery
- Generate Tracing records for a fixed period of time
curl -X POST http://{be_host}:{http_port}/api/pipeline/tracing?type=periodic
Set the time period (in seconds):
curl -X POST http://{be_host}:{http_port}/api/pipeline/tracing?dump_interval=60
2. Format Conversion
The logged data will be generated in the log/tracing directory of the corresponding BE. The next step is to convert the data to a file that matches the format required by the visualisation tool. A conversion tool is provided to convert the tracing logs generated by the BE, which can be executed directly:
cd doris/tools/pipeline-tracing/
python3 origin-to-show.py -s <SOURCE_FILE> -d <DEST>.json
to generate a json file that can be displayed. For more detailed instructions, see the README.md file in this directory.
3. Visualisation
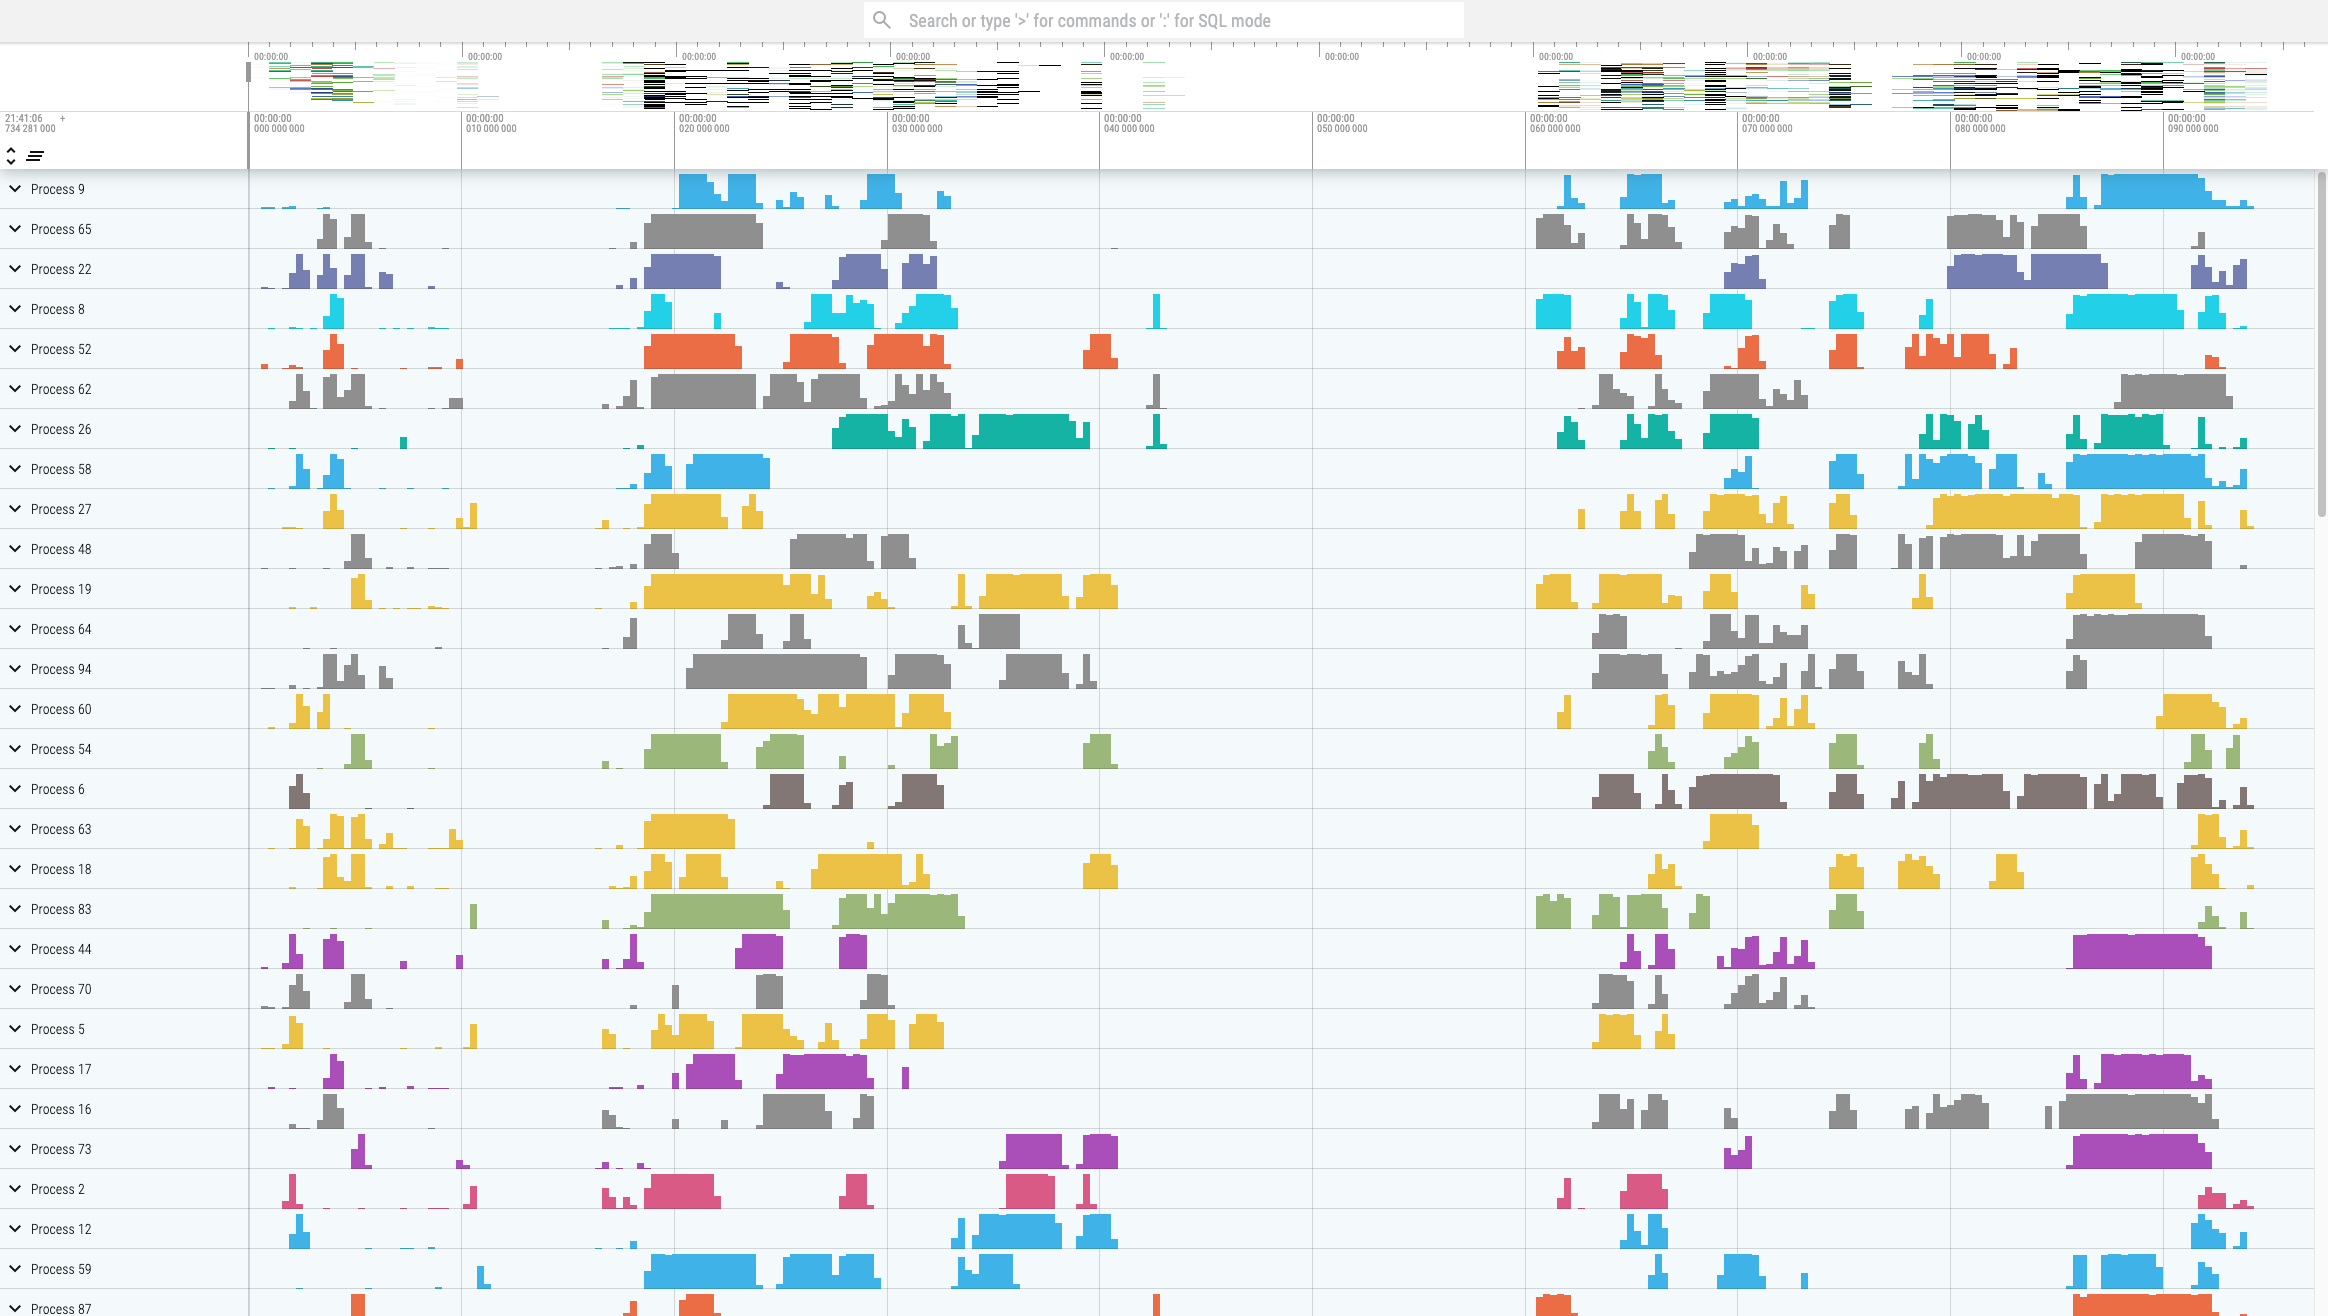
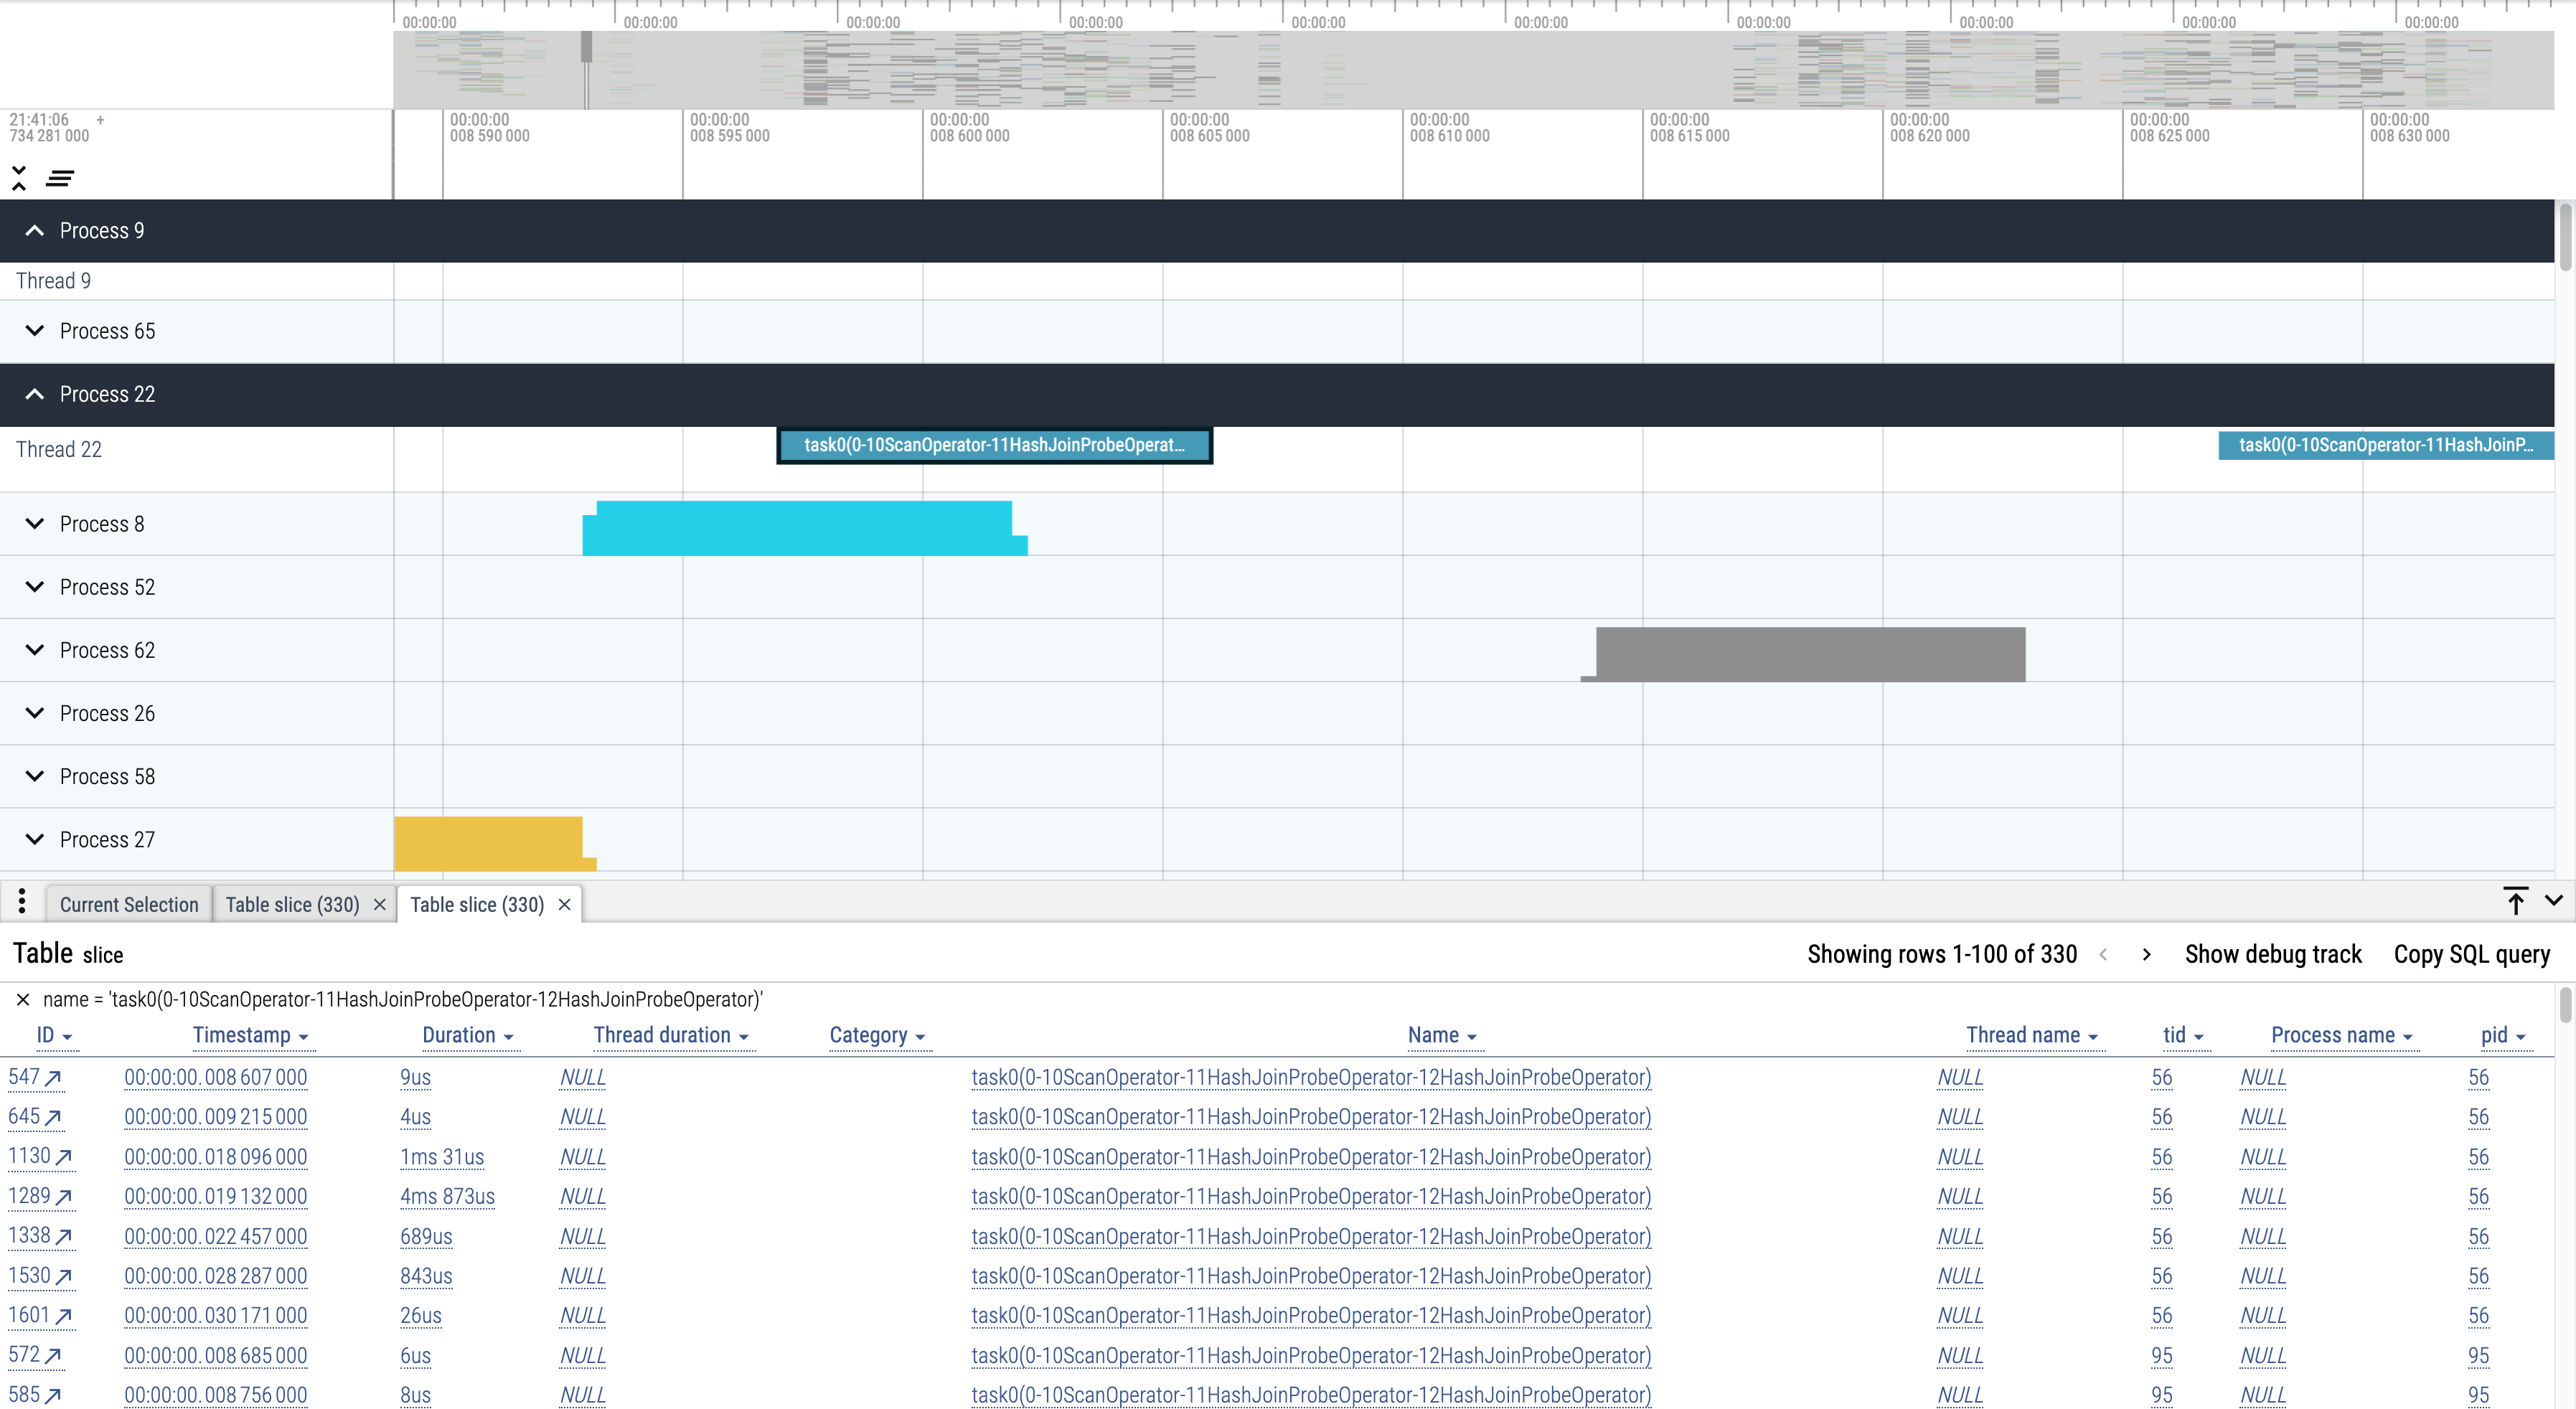
Pipeline Tracing is visualised using Perfetto. After generating a file in the legal format, select "Open trace file" on its page to open the file and view the results:

The tool is very powerful. For example, it is easy to see how the same Task is scheduled across cores.

