
Monitoring and alarming
This document mainly introduces Doris's monitoring items and how to collect and display them. And how to configure alarm (TODO)
Dashboard template click download
| Doris Version | Dashboard Version |
|---|---|
| 1.2.x | revision 5 |
Dashboard templates are updated from time to time. The way to update the template is shown in the last section.
Welcome to provide better dashboard.
Components
Doris uses Prometheus and Grafana to collect and display input monitoring items.
-
Prometheus
Prometheus is an open source system monitoring and alarm suite. It can collect monitored items by Pull or Push and store them in its own time series database. And through the rich multi-dimensional data query language, to meet the different data display needs of users.
-
Grafana
Grafana is an open source data analysis and display platform. Support multiple mainstream temporal database sources including Prometheus. Through the corresponding database query statements, the display data is obtained from the data source. With flexible and configurable dashboard, these data can be quickly presented to users in the form of graphs.
Note: This document only provides a way to collect and display Doris monitoring data using Prometheus and Grafana. In principle, these components are not developed or maintained. For more details on these components, please step through the corresponding official documents.
Monitoring data
Doris's monitoring data is exposed through the HTTP interface of Frontend and Backend. Monitoring data is presented in the form of key-value text. Each Key may also be distinguished by different Labels. When the user has built Doris, the monitoring data of the node can be accessed in the browser through the following interfaces:
- Frontend:
fe_host:fe_http_port/metrics - Backend:
be_host:be_web_server_port/metrics - Broker: Not available for now
Users will see the following monitoring item results (for example, FE partial monitoring items):
# HELP  jvm_heap_size_bytes jvm heap stat
# TYPE  jvm_heap_size_bytes gauge
jvm_heap_size_bytes{type="max"} 8476557312
jvm_heap_size_bytes{type="committed"} 1007550464
jvm_heap_size_bytes{type="used"} 156375280
# HELP  jvm_non_heap_size_bytes jvm non heap stat
# TYPE  jvm_non_heap_size_bytes gauge
jvm_non_heap_size_bytes{type="committed"} 194379776
jvm_non_heap_size_bytes{type="used"} 188201864
# HELP  jvm_young_size_bytes jvm young mem pool stat
# TYPE  jvm_young_size_bytes gauge
jvm_young_size_bytes{type="used"} 40652376
jvm_young_size_bytes{type="peak_used"} 277938176
jvm_young_size_bytes{type="max"} 907345920
# HELP  jvm_old_size_bytes jvm old mem pool stat
# TYPE  jvm_old_size_bytes gauge
jvm_old_size_bytes{type="used"} 114633448
jvm_old_size_bytes{type="peak_used"} 114633448
jvm_old_size_bytes{type="max"} 7455834112
# HELP  jvm_gc jvm gc stat
# TYPE  jvm_gc gauge
<GarbageCollector>{type="count"} 247
<GarbageCollector>{type="time"} 860
# HELP  jvm_thread jvm thread stat
# TYPE  jvm_thread gauge
jvm_thread{type="count"} 162
jvm_thread{type="peak_count"} 205
jvm_thread{type="new_count"} 0
jvm_thread{type="runnable_count"} 48
jvm_thread{type="blocked_count"} 1
jvm_thread{type="waiting_count"} 41
jvm_thread{type="timed_waiting_count"} 72
jvm_thread{type="terminated_count"} 0
...
This is a monitoring data presented in Prometheus Format. We take one of these monitoring items as an example to illustrate:
# HELP  jvm_heap_size_bytes jvm heap stat
# TYPE  jvm_heap_size_bytes gauge
jvm_heap_size_bytes{type="max"} 8476557312
jvm_heap_size_bytes{type="committed"} 1007550464
jvm_heap_size_bytes{type="used"} 156375280
- Behavior commentary line at the beginning of "#". HELP is the description of the monitored item; TYPE represents the data type of the monitored item, and Gauge is the scalar data in the example. There are also Counter, Histogram and other data types. Specifically, you can see Prometheus Official Document.
jvm_heap_size_bytesis the name of the monitored item (Key);type= "max"is a label namedtype, with a value ofmax. A monitoring item can have multiple Labels.- The final number, such as
8476557312, is the monitored value.
Monitoring Architecture
The entire monitoring architecture is shown in the following figure:
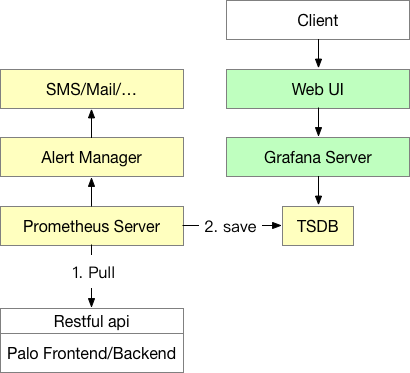
- The yellow part is Prometheus related components. Prometheus Server is the main process of Prometheus. At present, Prometheus accesses the monitoring interface of Doris node by Pull, and then stores the time series data in the time series database TSDB (TSDB is included in the Prometheus process, and need not be deployed separately). Prometheus also supports building Push Gateway to allow monitored data to be pushed to Push Gateway by Push by monitoring system, and then data from Push Gateway by Prometheus Server through Pull.
- Alert Manager is a Prometheus alarm component, which needs to be deployed separately (no solution is provided yet, but can be built by referring to official documents). Through Alert Manager, users can configure alarm strategy, receive mail, short messages and other alarms.
- The green part is Grafana related components. Grafana Server is the main process of Grafana. After startup, users can configure Grafana through Web pages, including data source settings, user settings, Dashboard drawing, etc. This is also where end users view monitoring data.
Start building
Please start building the monitoring system after you have completed the deployment of Doris.
Prometheus
-
Download the latest version of Prometheus on the Prometheus Website. Here we take version 2.43.0-linux-amd64 as an example.
-
Unzip the downloaded tar file on the machine that is ready to run the monitoring service.
-
Open the configuration file prometheus.yml. Here we provide an example configuration and explain it (the configuration file is in YML format, pay attention to uniform indentation and spaces):
Here we use the simplest way of static files to monitor configuration. Prometheus supports a variety of service discovery, which can dynamically sense the addition and deletion of nodes.
# my global config
global:
  scrape_interval:     15s # Global acquisition interval, default 1 m, set to 15s
  evaluation_interval: 15s # Global rule trigger interval, default 1 m, set 15s here

# Alertmanager configuration
alerting:
  alertmanagers:
  - static_configs:
    - targets:
      # - alertmanager:9093

# A scrape configuration containing exactly one endpoint to scrape:
# Here it's Prometheus itself.
scrape_configs:
  # The job name is added as a label `job=<job_name>` to any timeseries scraped from this config.
  - job_name: 'DORIS_CLUSTER' # Each Doris cluster, we call it a job. Job can be given a name here as the name of Doris cluster in the monitoring system.
    metrics_path: '/metrics' # Here you specify the restful API to get the monitors. With host: port in the following targets, Prometheus will eventually collect monitoring items through host: port/metrics_path.
    static_configs: # Here we begin to configure the target addresses of FE and BE, respectively. All FE and BE are written into their respective groups.
      - targets: ['fe_host1:8030', 'fe_host2:8030', 'fe_host3:8030']
        labels:
          group: fe # Here configure the group of fe, which contains three Frontends

      - targets: ['be_host1:8040', 'be_host2:8040', 'be_host3:8040']
        labels:
          group: be # Here configure the group of be, which contains three Backends

  - job_name: 'DORIS_CLUSTER_2' # We can monitor multiple Doris clusters in a Prometheus, where we begin the configuration of another Doris cluster. Configuration is the same as above, the following is outlined.
    metrics_path: '/metrics'
    static_configs:
      - targets: ['fe_host1:8030', 'fe_host2:8030', 'fe_host3:8030']
        labels:
          group: fe

      - targets: ['be_host1:8040', 'be_host2:8040', 'be_host3:8040']
        labels:
          group: be
-
start Prometheus
Start Prometheus with the following command:
nohup ./prometheus --web.listen-address="0.0.0.0:8181" &This command will run Prometheus in the background and specify its Web port as 8181. After startup, data is collected and stored in the data directory.
-
stop Promethues
At present, there is no formal way to stop the process, kill - 9 directly. Of course, Prometheus can also be set as a service to start and stop in a service way.
-
access Prometheus
Prometheus can be easily accessed through web pages. The page of Prometheus can be accessed by opening port 8181 through browser. Click on the navigation bar,
Status->Targets, and you can see all the monitoring host nodes of the grouped Jobs. Normally, all nodes should beUP, indicating that data acquisition is normal. Click on anEndpointto see the current monitoring value. If the node state is not UP, you can first access Doris's metrics interface (see previous article) to check whether it is accessible, or query Prometheus related documents to try to resolve. -
So far, a simple Prometheus has been built and configured. For more advanced usage, see Official Documents
Grafana
-
Download the latest version of Grafana on Grafana's official website. Here we take version 8.5.22.linux-amd64 as an example.
-
Unzip the downloaded tar file on the machine that is ready to run the monitoring service.
-
Open the configuration file conf/defaults.ini. Here we only list the configuration items that need to be changed, and the other configurations can be used by default.
# Path to where grafana can store temp files, sessions, and the sqlite3 db (if that is used)
data = data

# Directory where grafana can store logs
logs = data/log

# Protocol (http, https, socket)
protocal = http

# The ip address to bind to, empty will bind to all interfaces
http_addr =

# The http port to use
http_port = 8182 -
start Grafana
Start Grafana with the following command
nohup ./bin/grafana-server &This command runs Grafana in the background, and the access port is 8182 configured above.
-
stop Grafana
At present, there is no formal way to stop the process, kill - 9 directly. Of course, you can also set Grafana as a service to start and stop as a service.
-
access Grafana
Through the browser, open port 8182, you can start accessing the Grafana page. The default username password is admin.
-
Configure Grafana
For the first landing, you need to set up the data source according to the prompt. Our data source here is Prometheus, which was configured in the previous step.
The Setting page of the data source configuration is described as follows:
- Name: Name of the data source, customized, such as doris_monitor_data_source
- Type: Select Prometheus
- URL: Fill in the web address of Prometheus, such as http://host:8181
- Access: Here we choose the Server mode, which is to access Prometheus through the server where the Grafana process is located.
- The other options are available by default.
- Click
Save & Testat the bottom. IfData source is working, it means that the data source is available. - After confirming that the data source is available, click on the + number in the left navigation bar and start adding Dashboard. Here we have prepared Doris's dashboard template (at the beginning of this document). When the download is complete, click
New dashboard->Import dashboard->Upload.json Fileabove to import the downloaded JSON file. - After importing, you can name Dashboard by default
Doris Overview. At the same time, you need to select the data source, where you select thedoris_monitor_data_sourceyou created earlier. - Click
Importto complete the import. Later, you can see Doris's dashboard display.
-
So far, a simple Grafana has been built and configured. For more advanced usage, see Official Documents
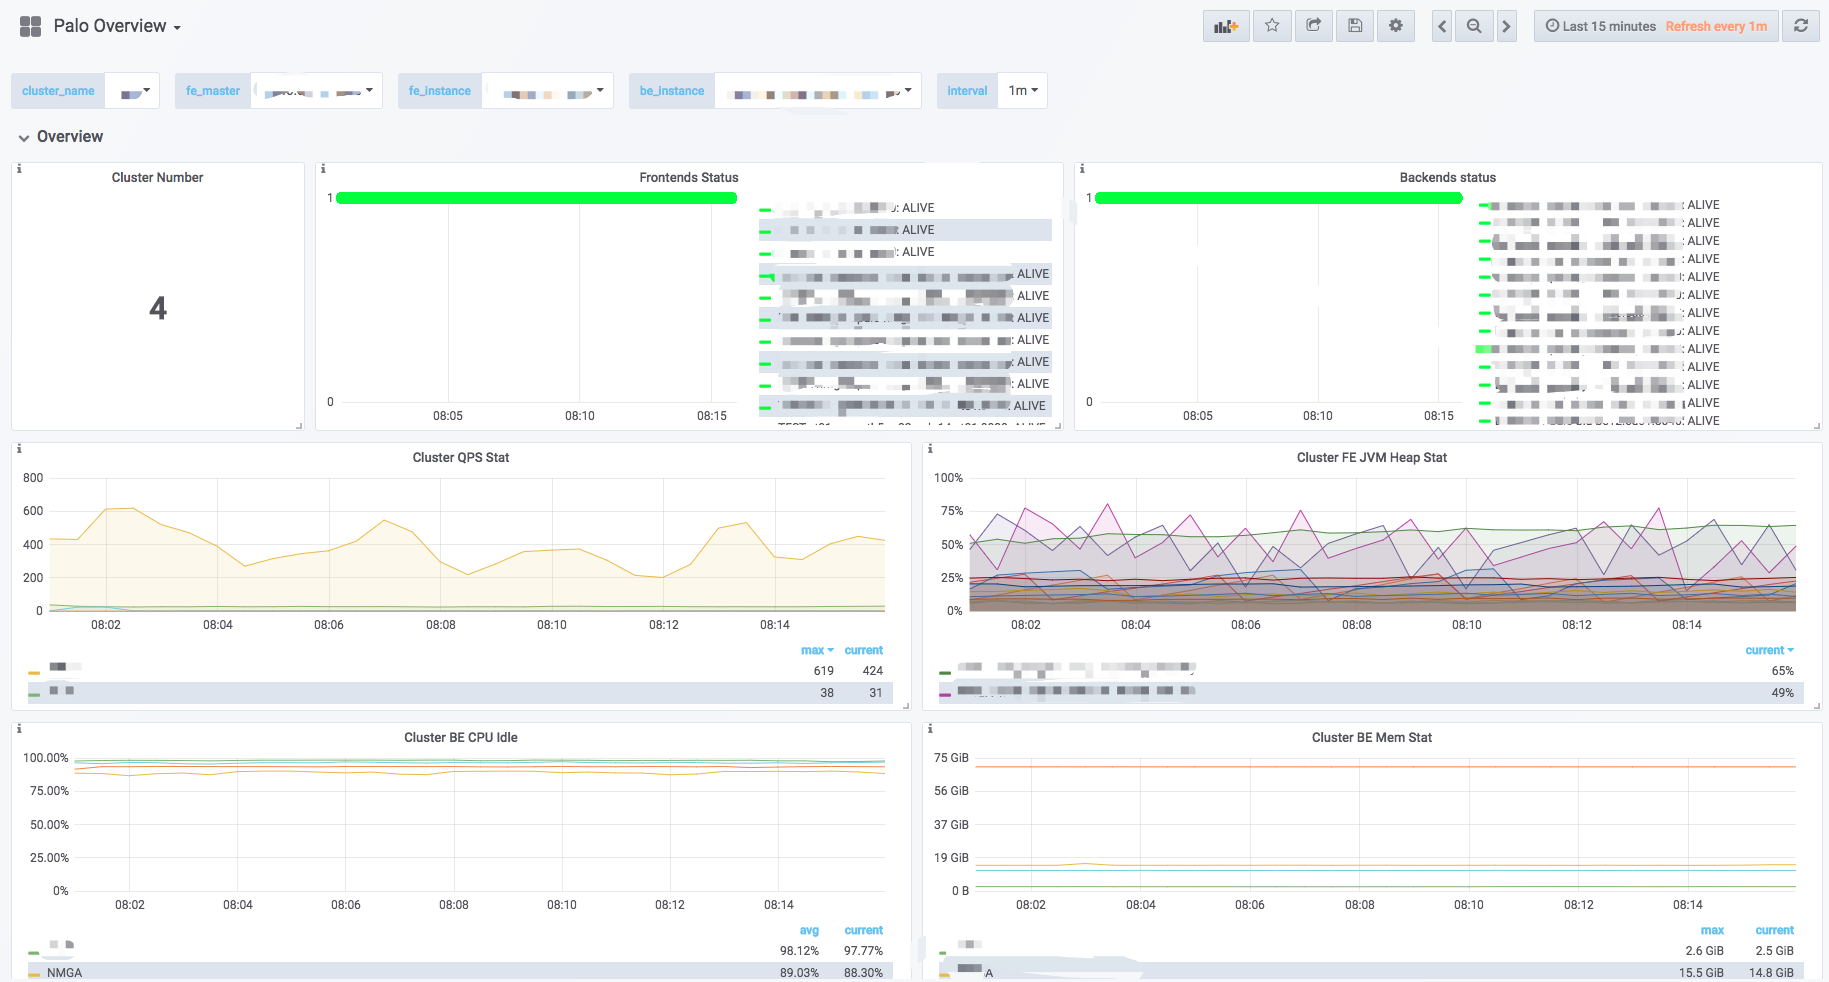
Dashboard
Here we briefly introduce Doris Dashboard. The content of Dashboard may change with the upgrade of version. This document is not guaranteed to be the latest Dashboard description.
-
Top Bar

- The upper left corner is the name of Dashboard.
- The upper right corner shows the current monitoring time range. You can choose different time ranges by dropping down. You can also specify a regular refresh page interval.
- Cluster name: Each job name in the Prometheus configuration file represents a Doris cluster. Select a different cluster, and the chart below shows the monitoring information for the corresponding cluster.
- fe_master: The Master Frontend node corresponding to the cluster.
- fe_instance: All Frontend nodes corresponding to the cluster. Select a different Frontend, and the chart below shows the monitoring information for the Frontend.
- be_instance: All Backend nodes corresponding to the cluster. Select a different Backend, and the chart below shows the monitoring information for the Backend.
- Interval: Some charts show rate-related monitoring items, where you can choose how much interval to sample and calculate the rate (Note: 15s interval may cause some charts to be unable to display).
-
Row.
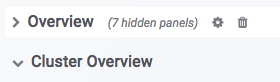
In Grafana, the concept of Row is a set of graphs. As shown in the figure above, Overview and Cluster Overview are two different Rows. Row can be folded by clicking Row. Currently Dashboard has the following Rows (in continuous updates):
- Overview: A summary display of all Doris clusters.
- Cluster Overview: A summary display of selected clusters.
- Query Statistic: Query-related monitoring of selected clusters.
- FE JVM: Select Frontend's JVM monitoring.
- BE: A summary display of the backends of the selected cluster.
- BE Task: Display of Backends Task Information for Selected Clusters.
-
Charts
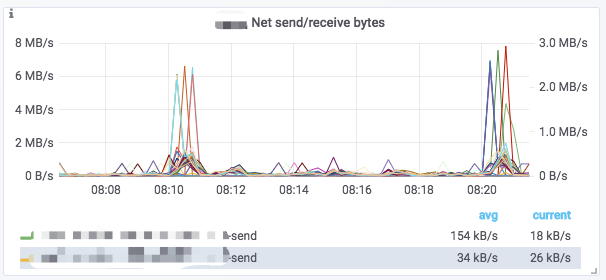
A typical icon is divided into the following parts:
- Hover the I icon in the upper left corner of the mouse to see the description of the chart.
- Click on the illustration below to view a monitoring item separately. Click again to display all.
- Dragging in the chart can select the time range.
- The selected cluster name is displayed in [] of the title.
- Some values correspond to the Y-axis on the left and some to the right, which can be distinguished by the
-rightat the end of the legend. - Click on the name of the chart ->
Editto edit the chart.
Dashboard Update
- Click on
+in the left column of Grafana andDashboard. - Click
New dashboardin the upper left corner, andImport dashboardappears on the right. - Click
Upload .json Fileto select the latest template file. - Selecting Data Sources
- Click on
Import (Overwrite)to complete the template update.