Power BI
Microsoft Power BI can query data from Apache Doris and can also load data into memory. With Power BI Desktop, you can connect to an Apache Doris data source and create reports, dashboards, and visual analytics.
Starting from the user workflow, this article describes how to complete the following operations:
| Use case | User goal | Main operations |
|---|---|---|
| Prepare the connection environment | Enable Power BI Desktop to connect to Doris | Install the MySQL ODBC driver and the Doris Power BI connector |
| Connect to a Doris data source | Access an Apache Doris instance from Power BI Desktop | Fill in the Doris Data Source, Database, authentication information, and data connectivity mode |
| Choose a query mode | Select a connection mode based on the data volume and the way you analyze data | Use DirectQuery to query Doris directly, or use Import to load a small amount of data into Power BI |
| Build a visualization dashboard | Build an analytics report based on TPC-H data in Doris | Create table relationships, drag and drop fields, and generate and save a dashboard |
Prepare the connection environment
Install Power BI Desktop
This article assumes that you have already installed Microsoft Power BI Desktop on a Windows computer. If it is not installed, you can visit the Power BI Desktop download page to download and install it.
It is recommended to update Power BI Desktop to the latest version.
Prepare Doris connection information
Before connecting to Apache Doris, collect the following information:
| Parameter | Meaning | Example |
|---|---|---|
| Doris Data Source | Database connection string in the format host:port | 127.0.1.28:9030 |
| Database | Database name | test_db |
| Data Connectivity Mode | Data connectivity mode, including Import and DirectQuery | DirectQuery |
| SQL Statement | SQL statement, must include the database, only applicable in Import mode | select * from database.table |
| User Name | User name | admin |
| Password | Password | xxxxxx |
Install the MySQL ODBC driver
To connect to Doris in Power BI Desktop, you need to install the MySQL ODBC driver first.
Install the driver
-
Download and install MySQL ODBC.
-
Select and configure version 5.3.
-
Run the downloaded
.msiinstaller and follow the installation wizard to complete the installation.
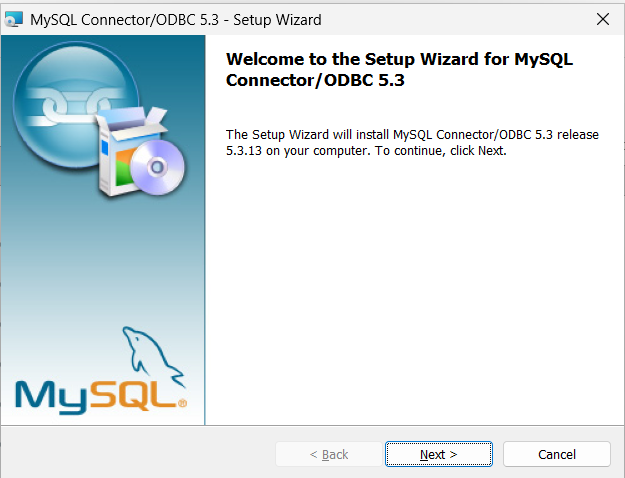
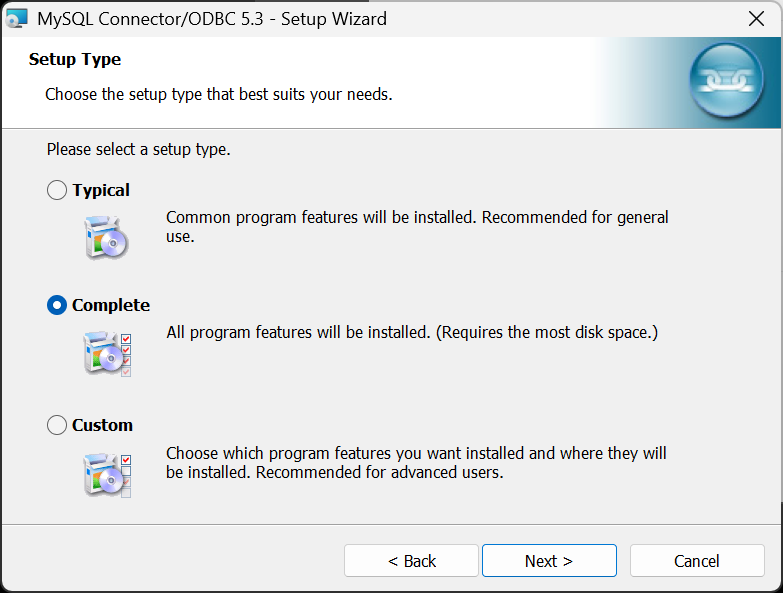
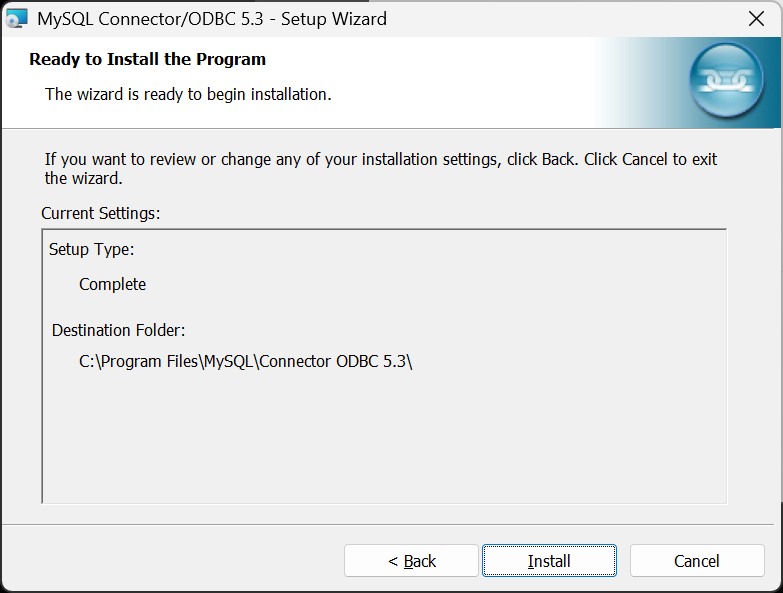
After the installation is complete, the following screen appears.
Verify the driver
After the driver is installed, you can verify the installation as follows:
- In the Windows Start menu, type
ODBCand select ODBC Data Sources (64-bit).
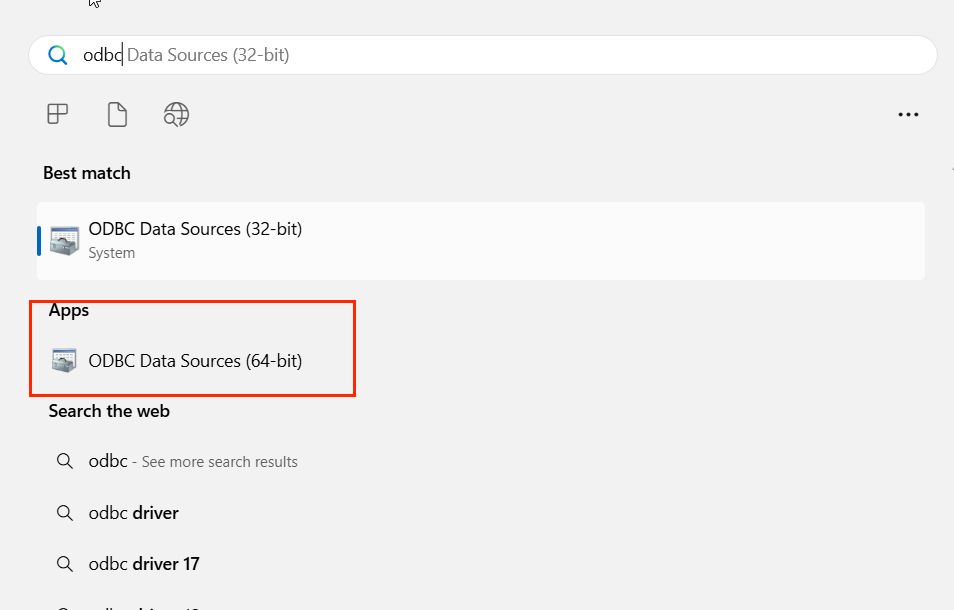
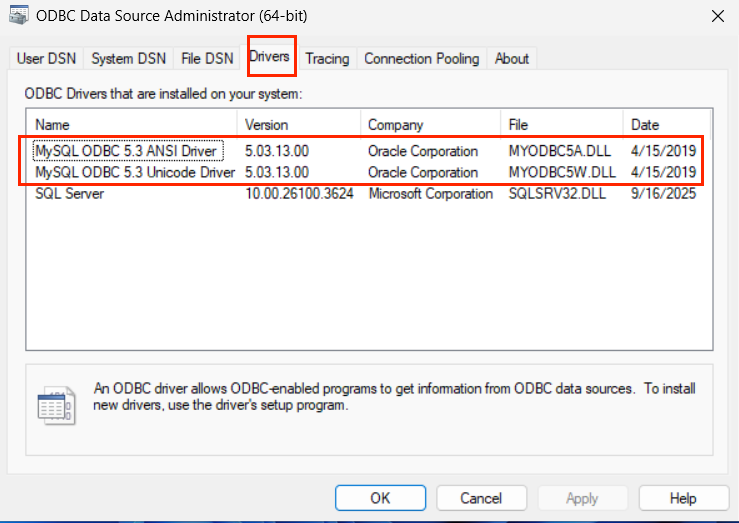
- Confirm that the MySQL driver appears in the driver list.
Install the Doris Power BI connector
The Power BI custom connector certification channel is currently closed, so the custom connector provided by Doris is an uncertified connector. For uncertified connectors, refer to the Power BI custom connector configuration documentation to complete the following configuration.
Place the connector file
-
Assume that
power_bi_pathis the installation directory of Power BI Desktop on the Windows operating system. The default is usually:power_bi_path = C:\Program Files\Power BI Desktop -
Place the Doris.mez custom connector file under the
%power_bi_path%\Custom Connectors folderpath. -
If the path above does not exist, create it manually as needed.
Allow loading uncertified connectors
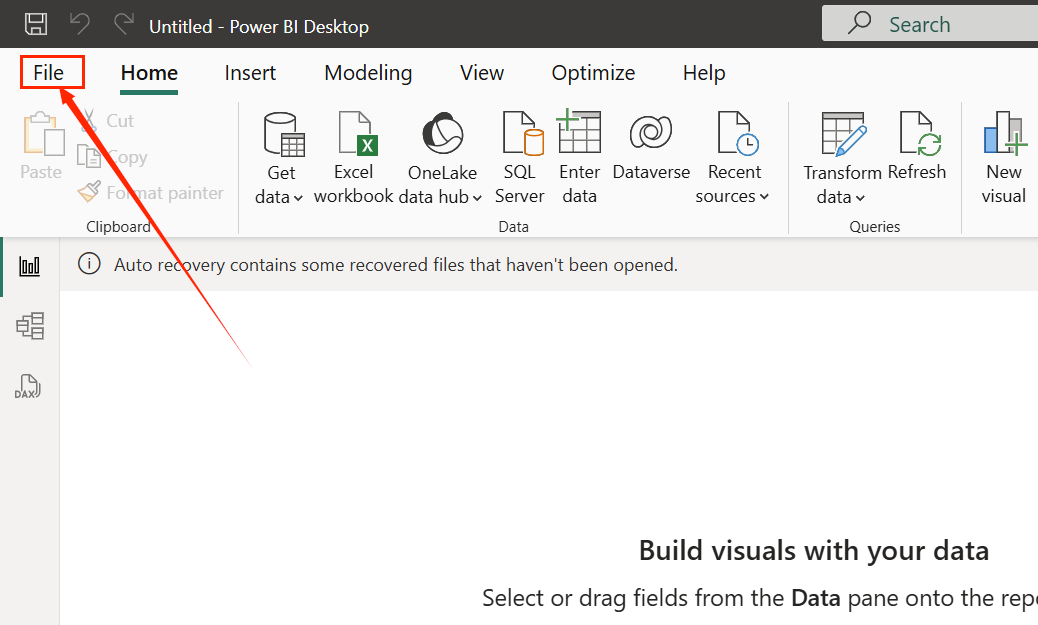
- In Power BI Desktop, select File.
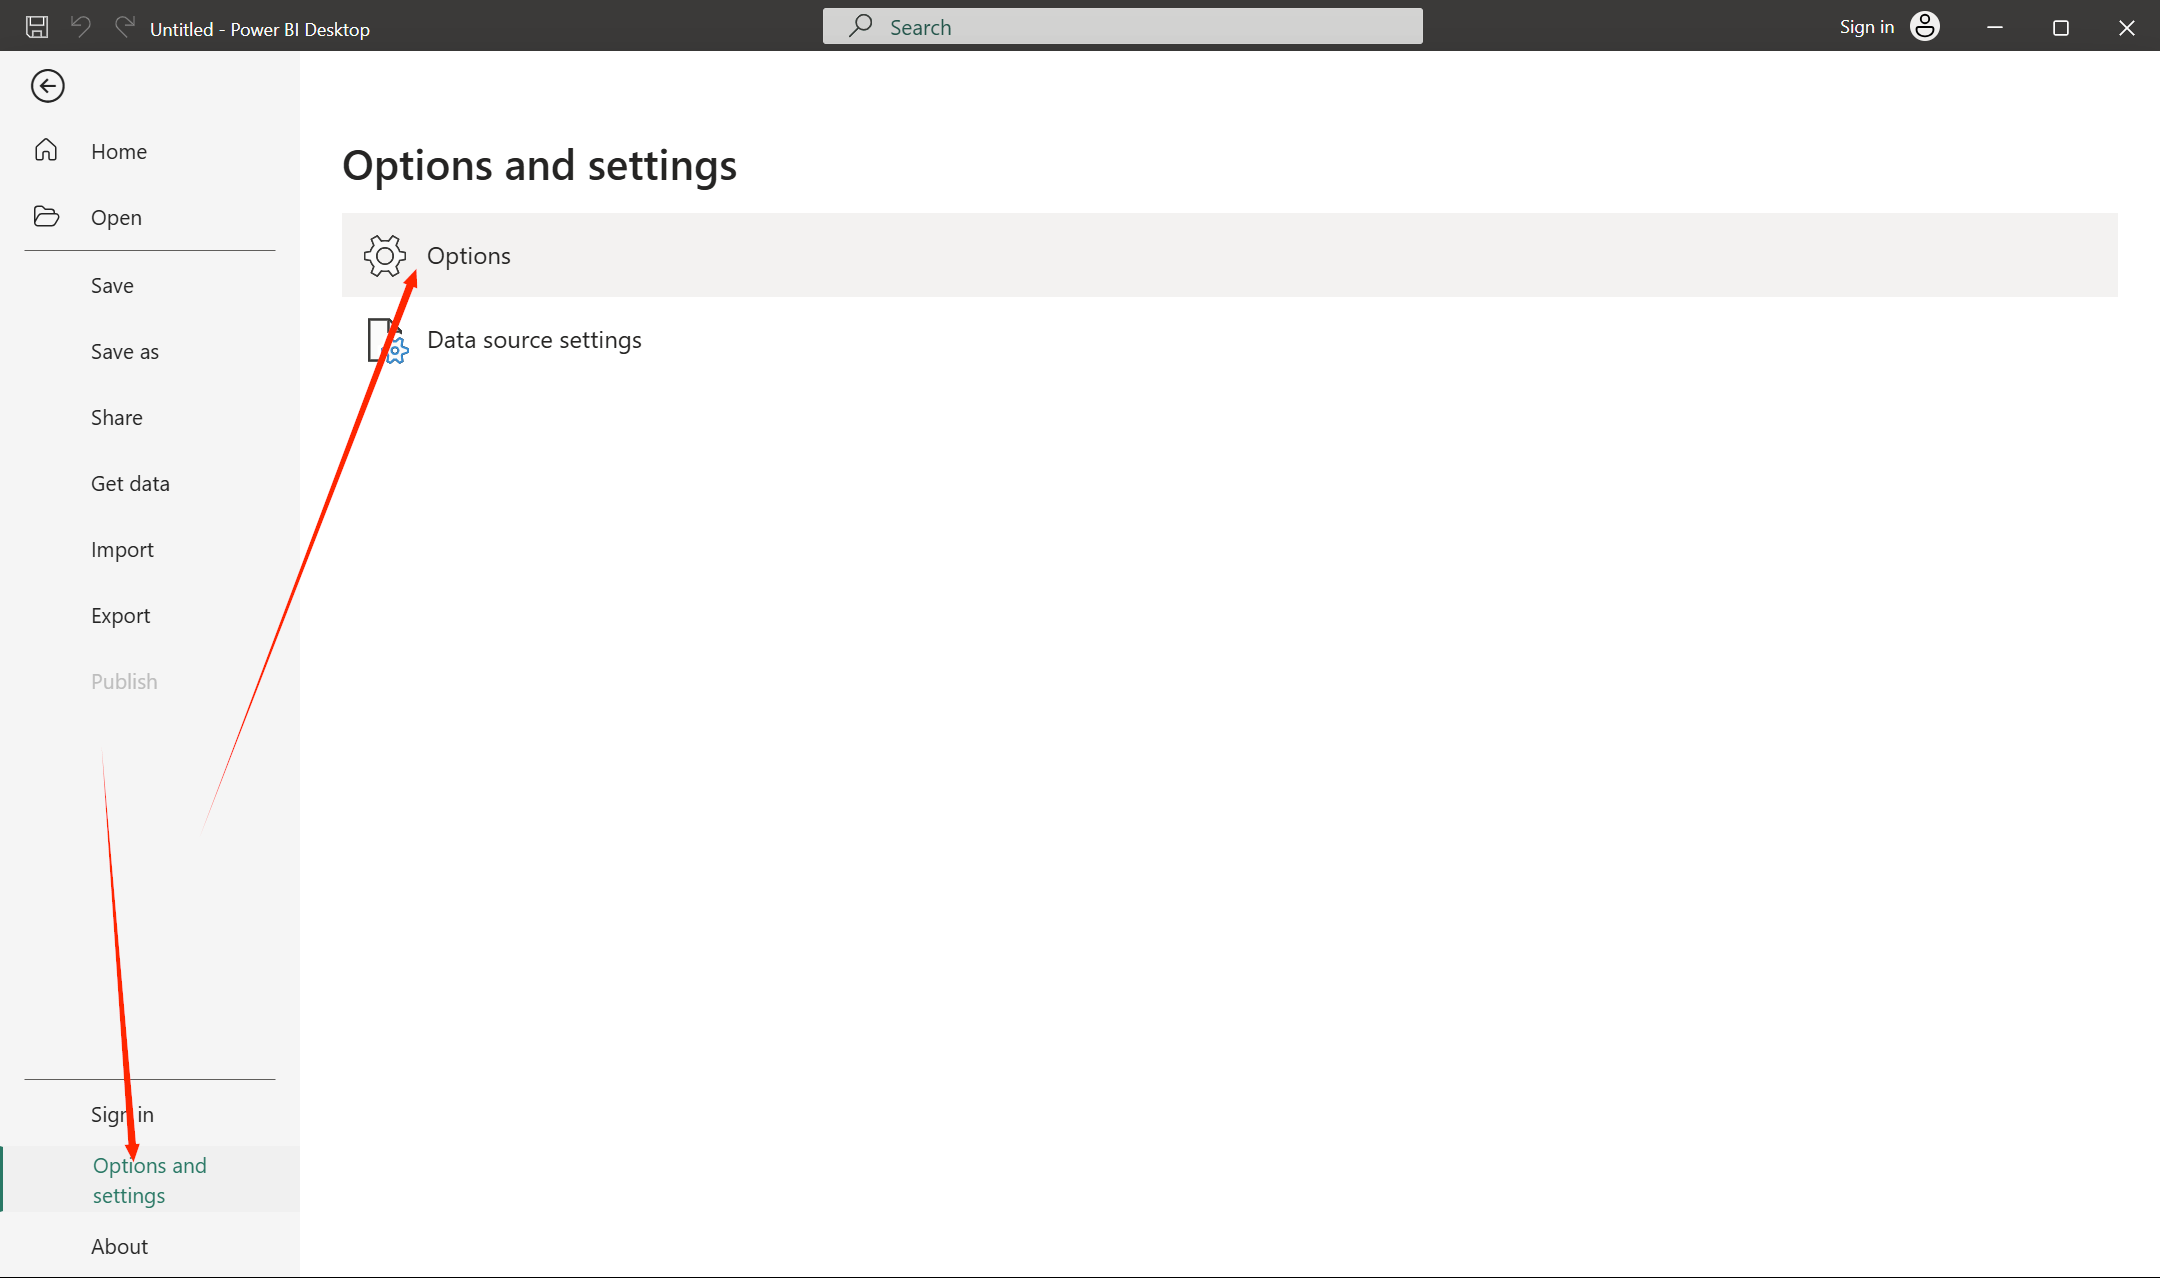
- Select Options and settings > Options.
- On the Options screen, select GLOBAL > Security. Under Data Extensions, check (Not Recommended) Allow any extension to load without validation or warning to lift the restriction on uncertified connectors.
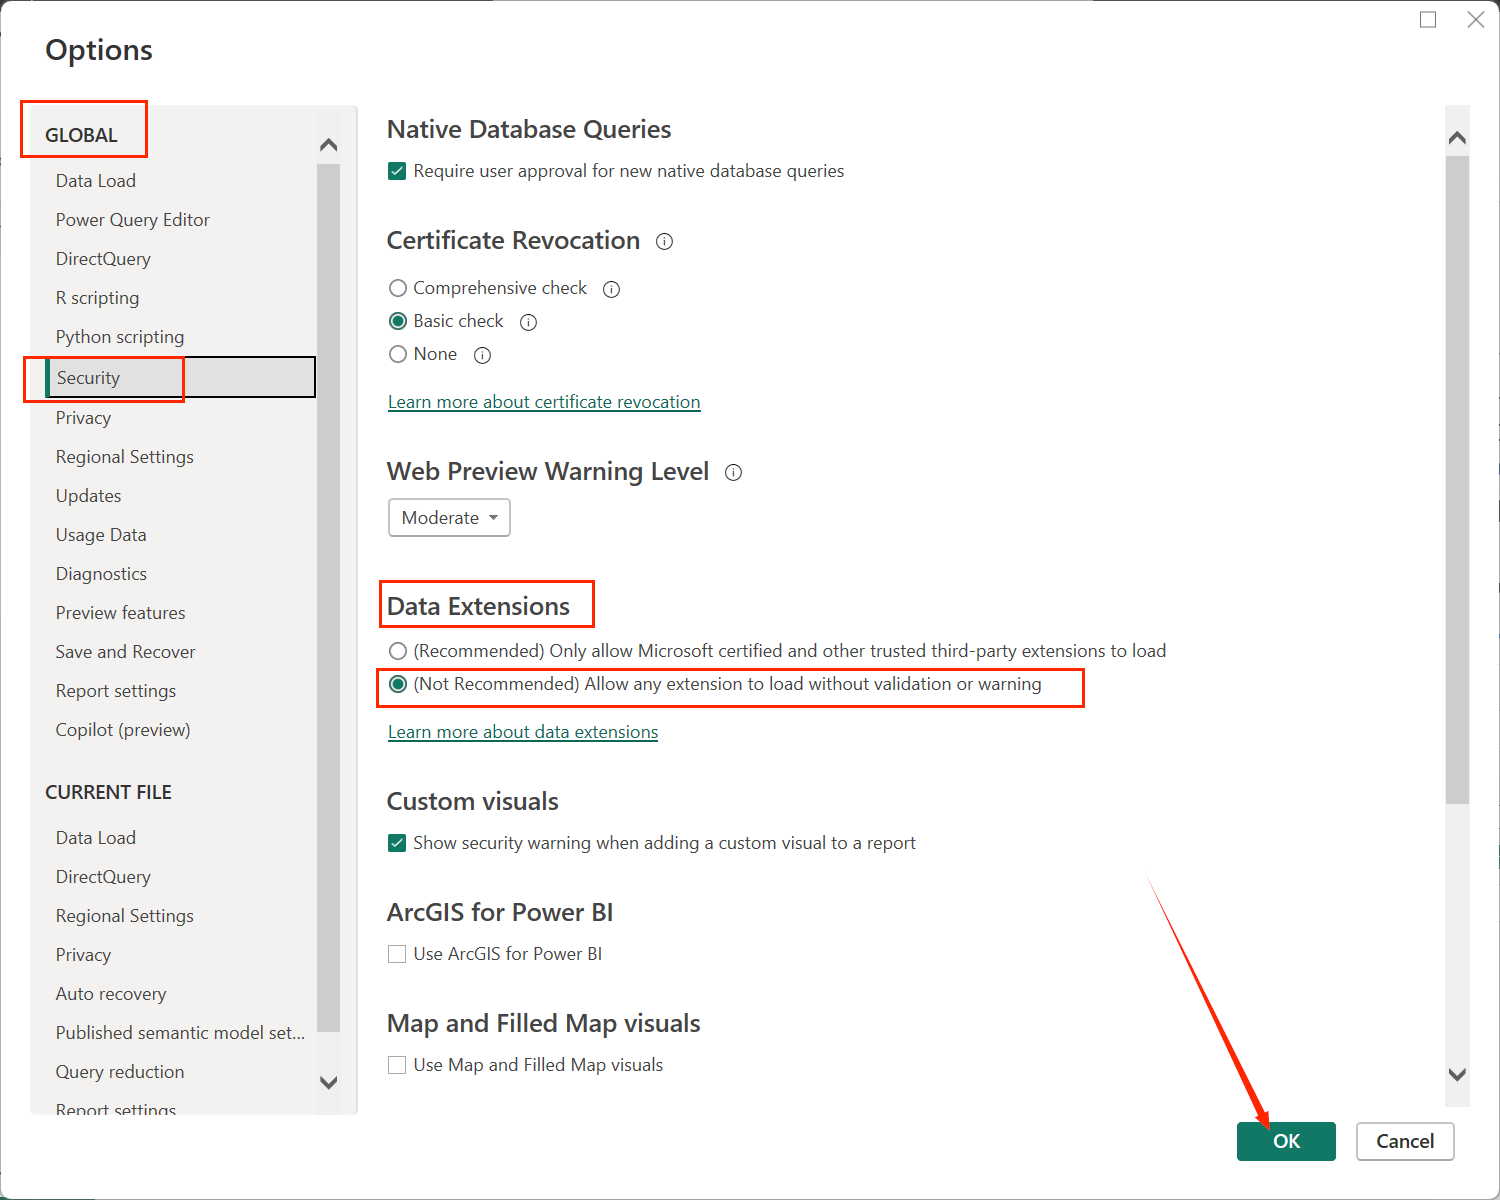
- Select OK and then restart Power BI Desktop.
Connect to Doris in Power BI Desktop
After installing the driver and connector, you can find the Doris connector in Power BI Desktop and create a Doris data source.
Find the Doris connector
-
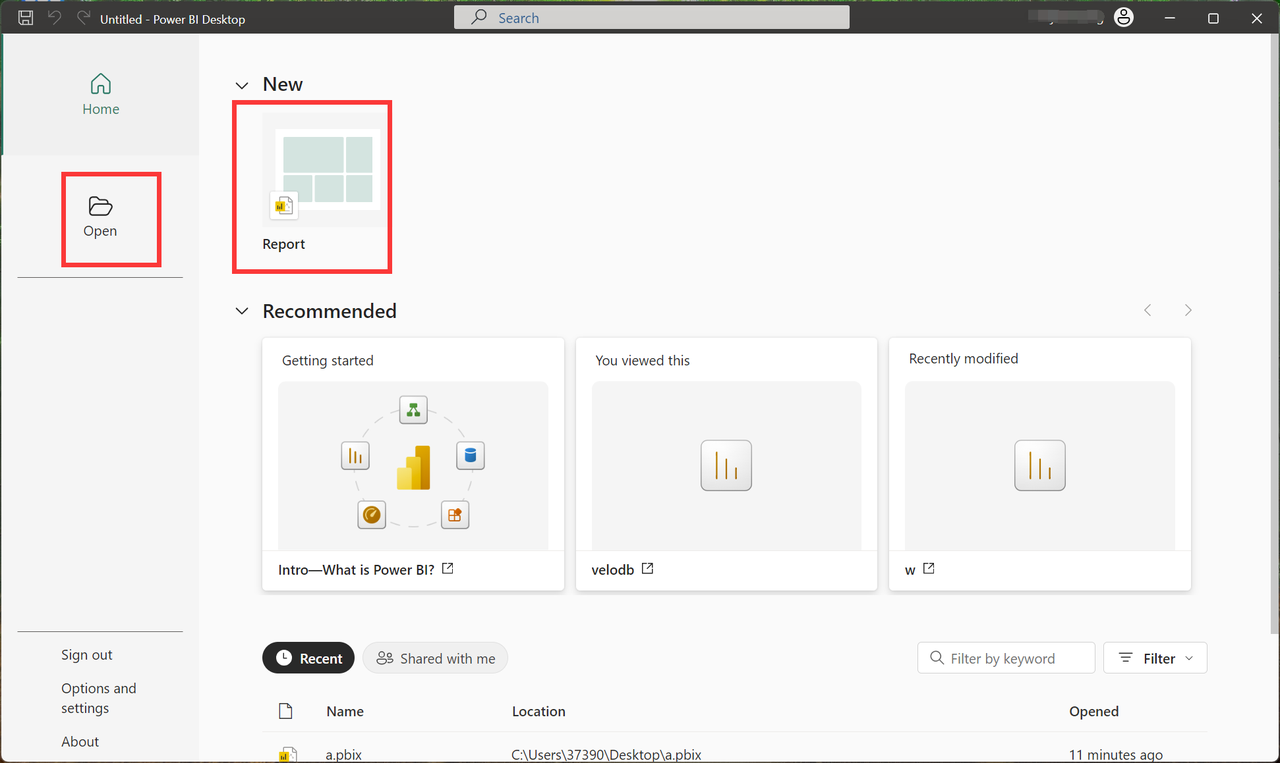
Launch Power BI Desktop.
-
On the Power BI Desktop start screen, click New Report. If you already have a local report, you can also choose to open an existing report.
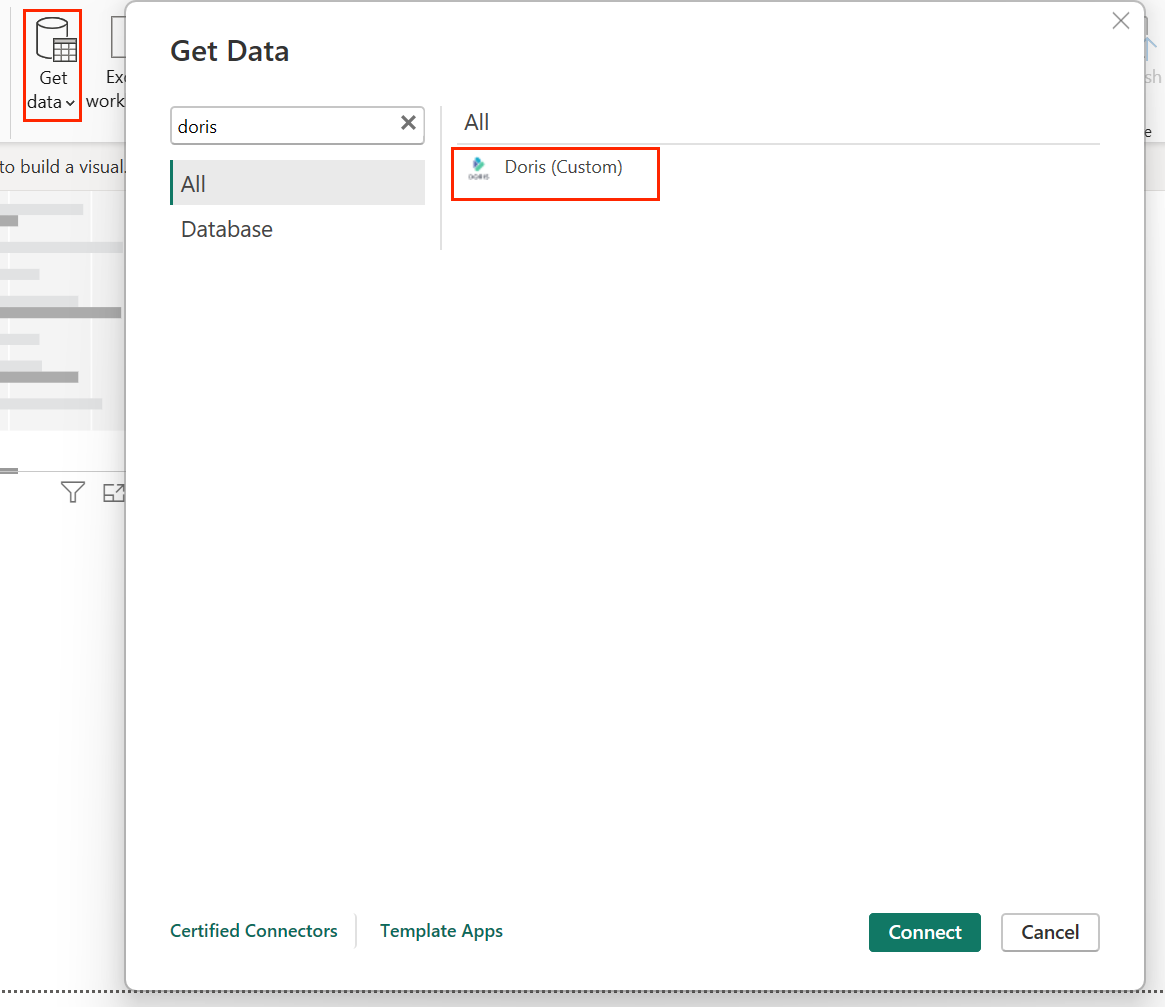
- Click Get Data and select the Doris database in the pop-up window.
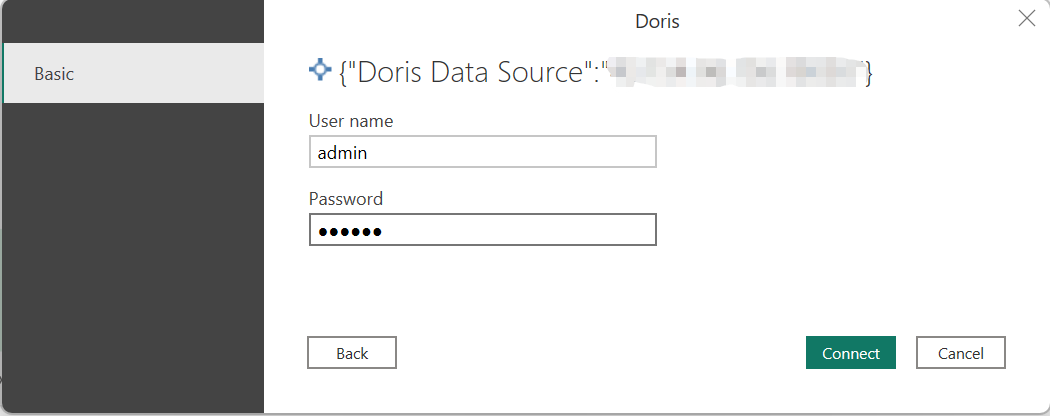
Fill in connection information
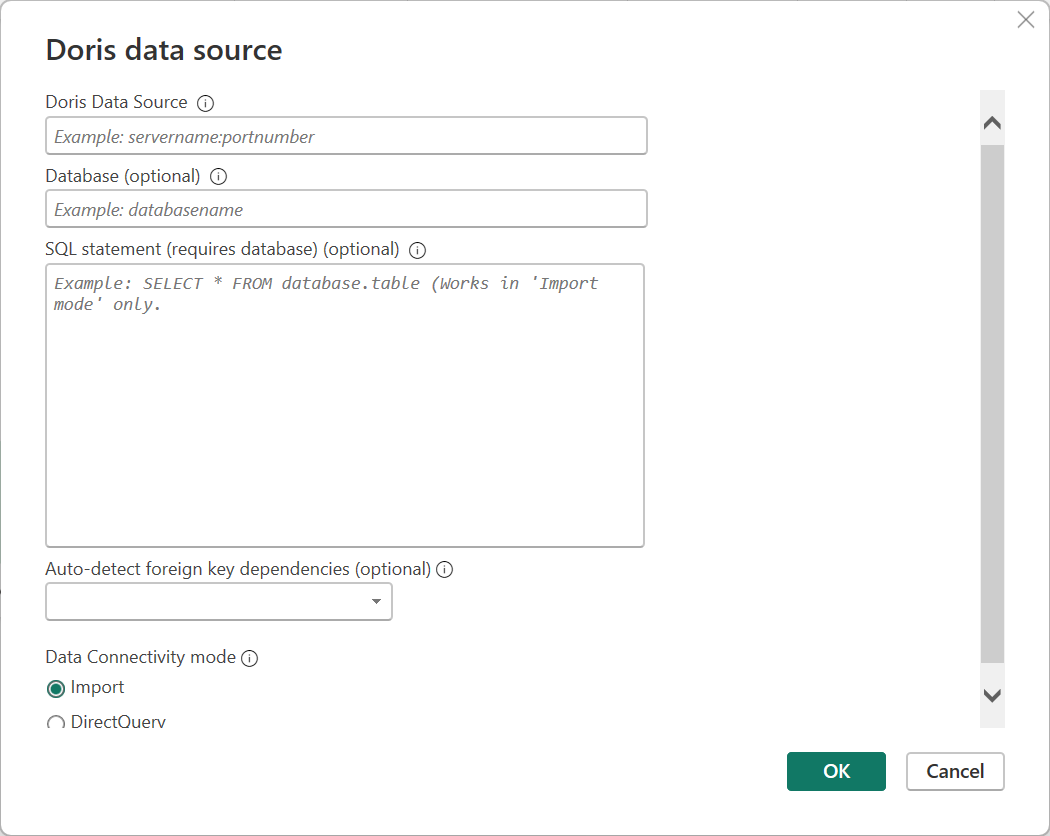
After selecting the Doris connector, enter the Doris instance credentials:
| Parameter | Required | Description |
|---|---|---|
| Doris Data Source | Required | Doris instance domain name, address, or host:port |
| Database | Required | Doris database name |
| SQL statement | Optional | SQL statement to execute beforehand, only available in Import mode |
| Data connectivity mode | Required | Choose DirectQuery or Import |
Recommendations for choosing a connection mode:
| Mode | Applicable scenario | Description |
|---|---|---|
| DirectQuery | Recommended for querying Doris directly | Power BI does not load the full data set; instead, it sends queries directly to Doris |
| Import | Suitable for small data scenarios | The entire data set is loaded into Power BI |
It is recommended to choose DirectQuery to query Doris directly. If your use case involves only a small amount of data, you can choose Import mode.
Enter user name and password
Specify the Doris user name and password.
Load the table schema and preview data
In the navigator view, you should be able to see databases and tables. Select the desired tables and click Load to load the table schema and preview data from Apache Doris.
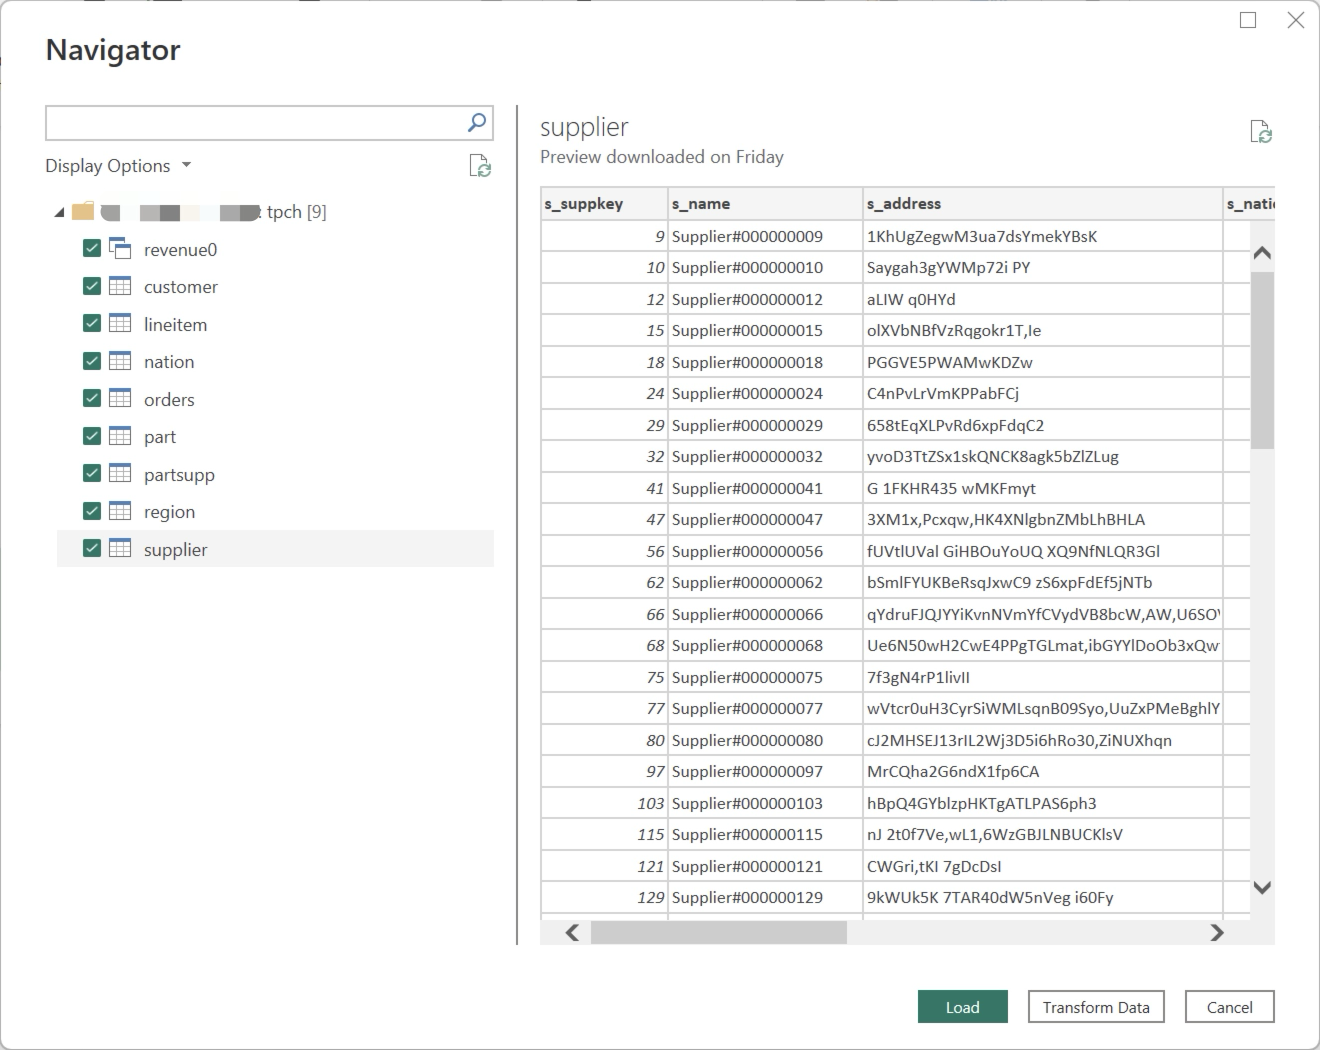
After the import is complete, Doris data is accessible in Power BI as expected. You can then configure the statistical dashboard you need.
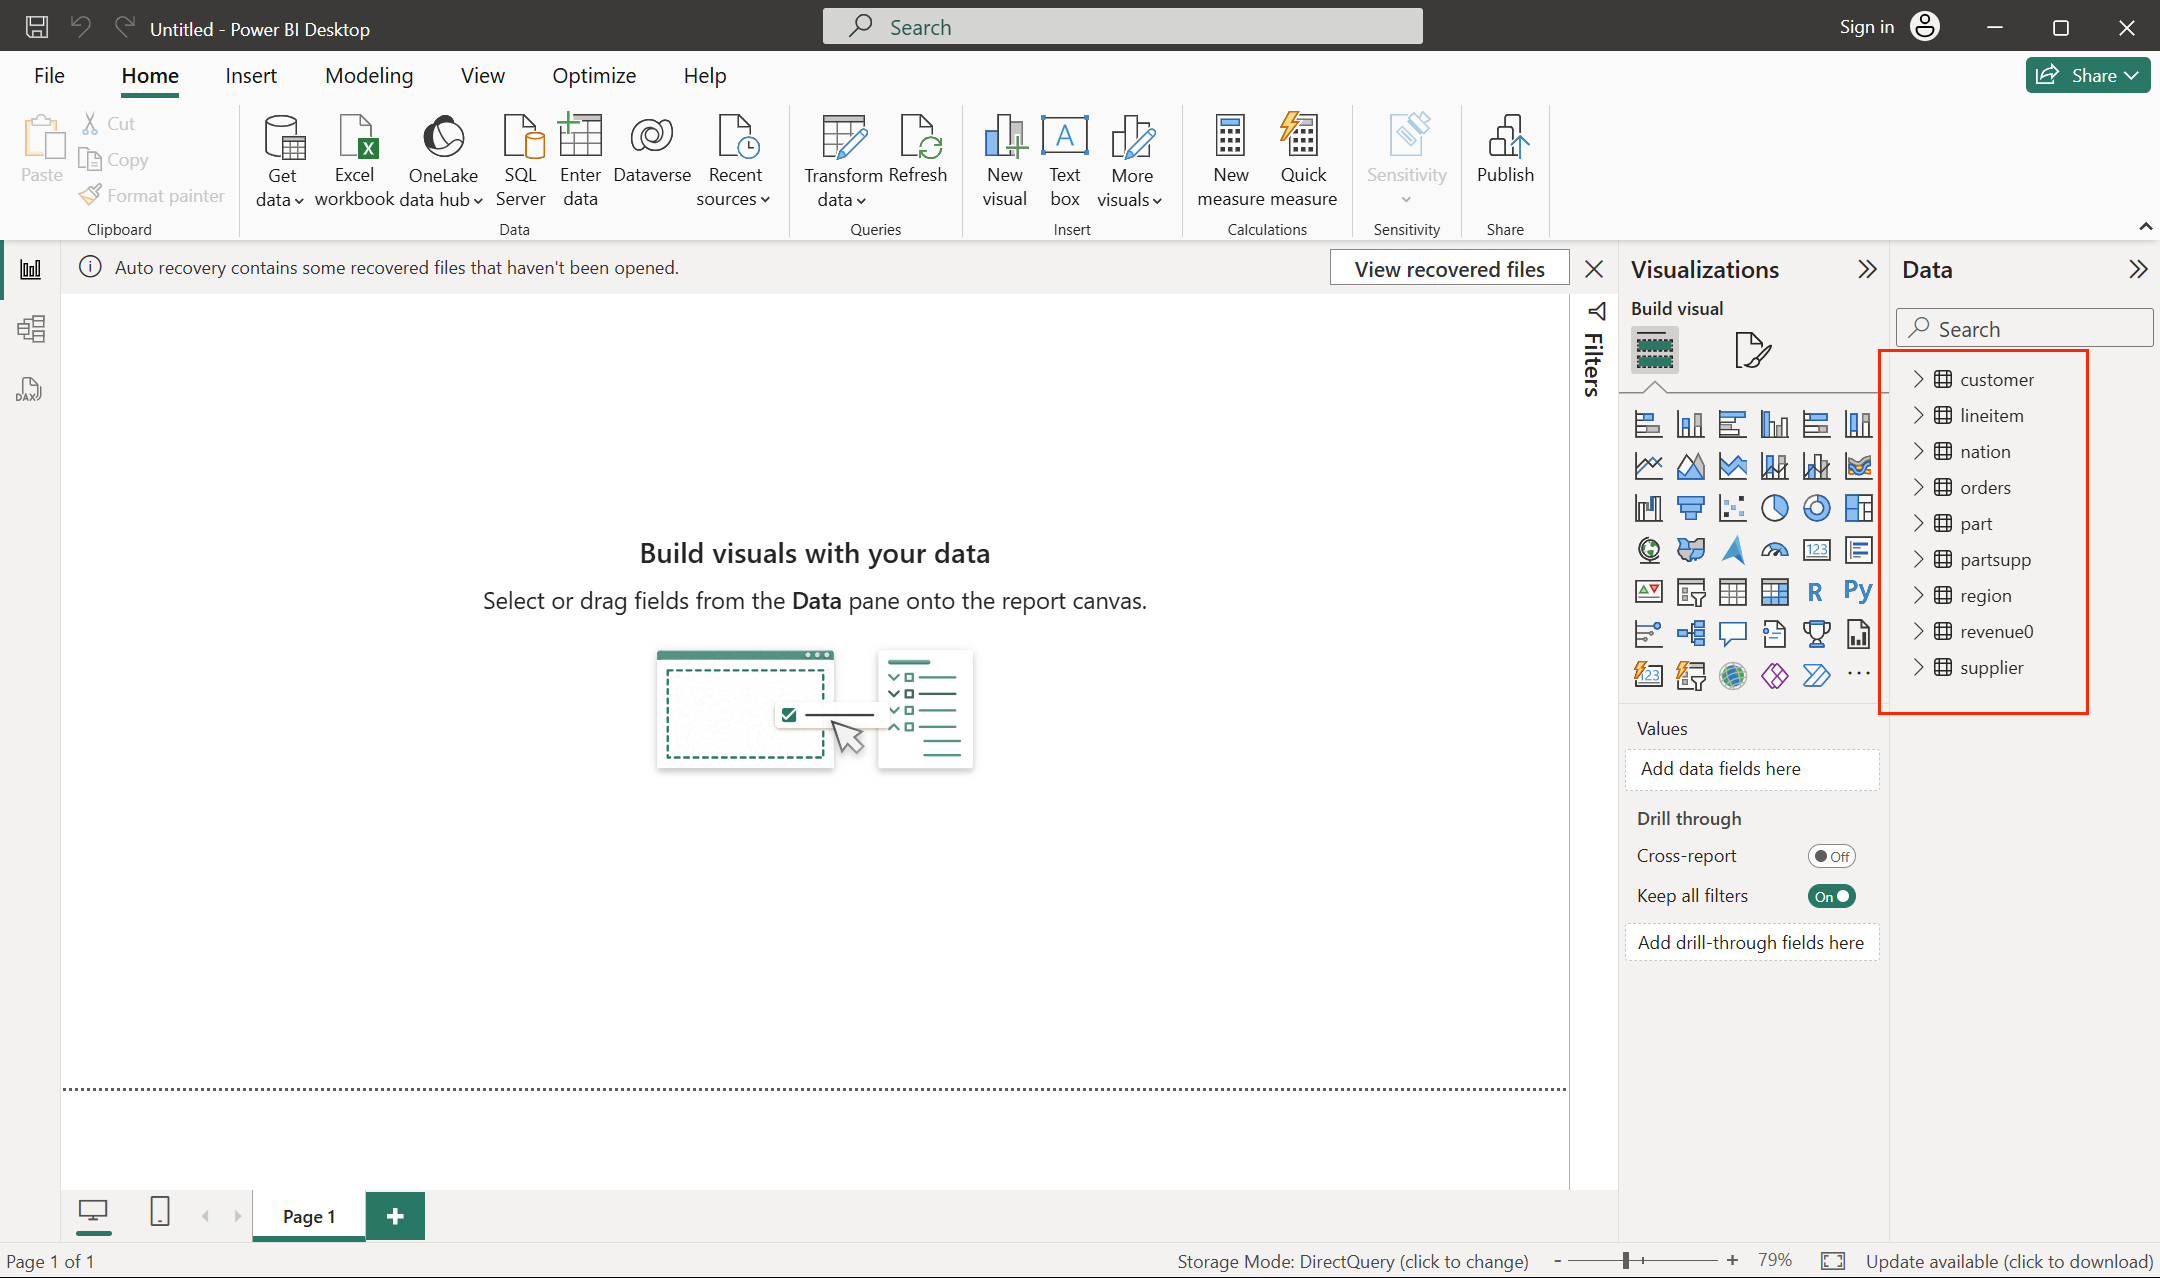
Build a visualization dashboard in Power BI
This example uses TPC-H data as the data source. For how to build the Doris TPC-H data source, refer to the Doris TPC-H Benchmark documentation.
Suppose you need to count order revenue across regions. You can build the dashboard with the following process.
Create table model relationships
- Click Model view to enter the table model relationship configuration screen.
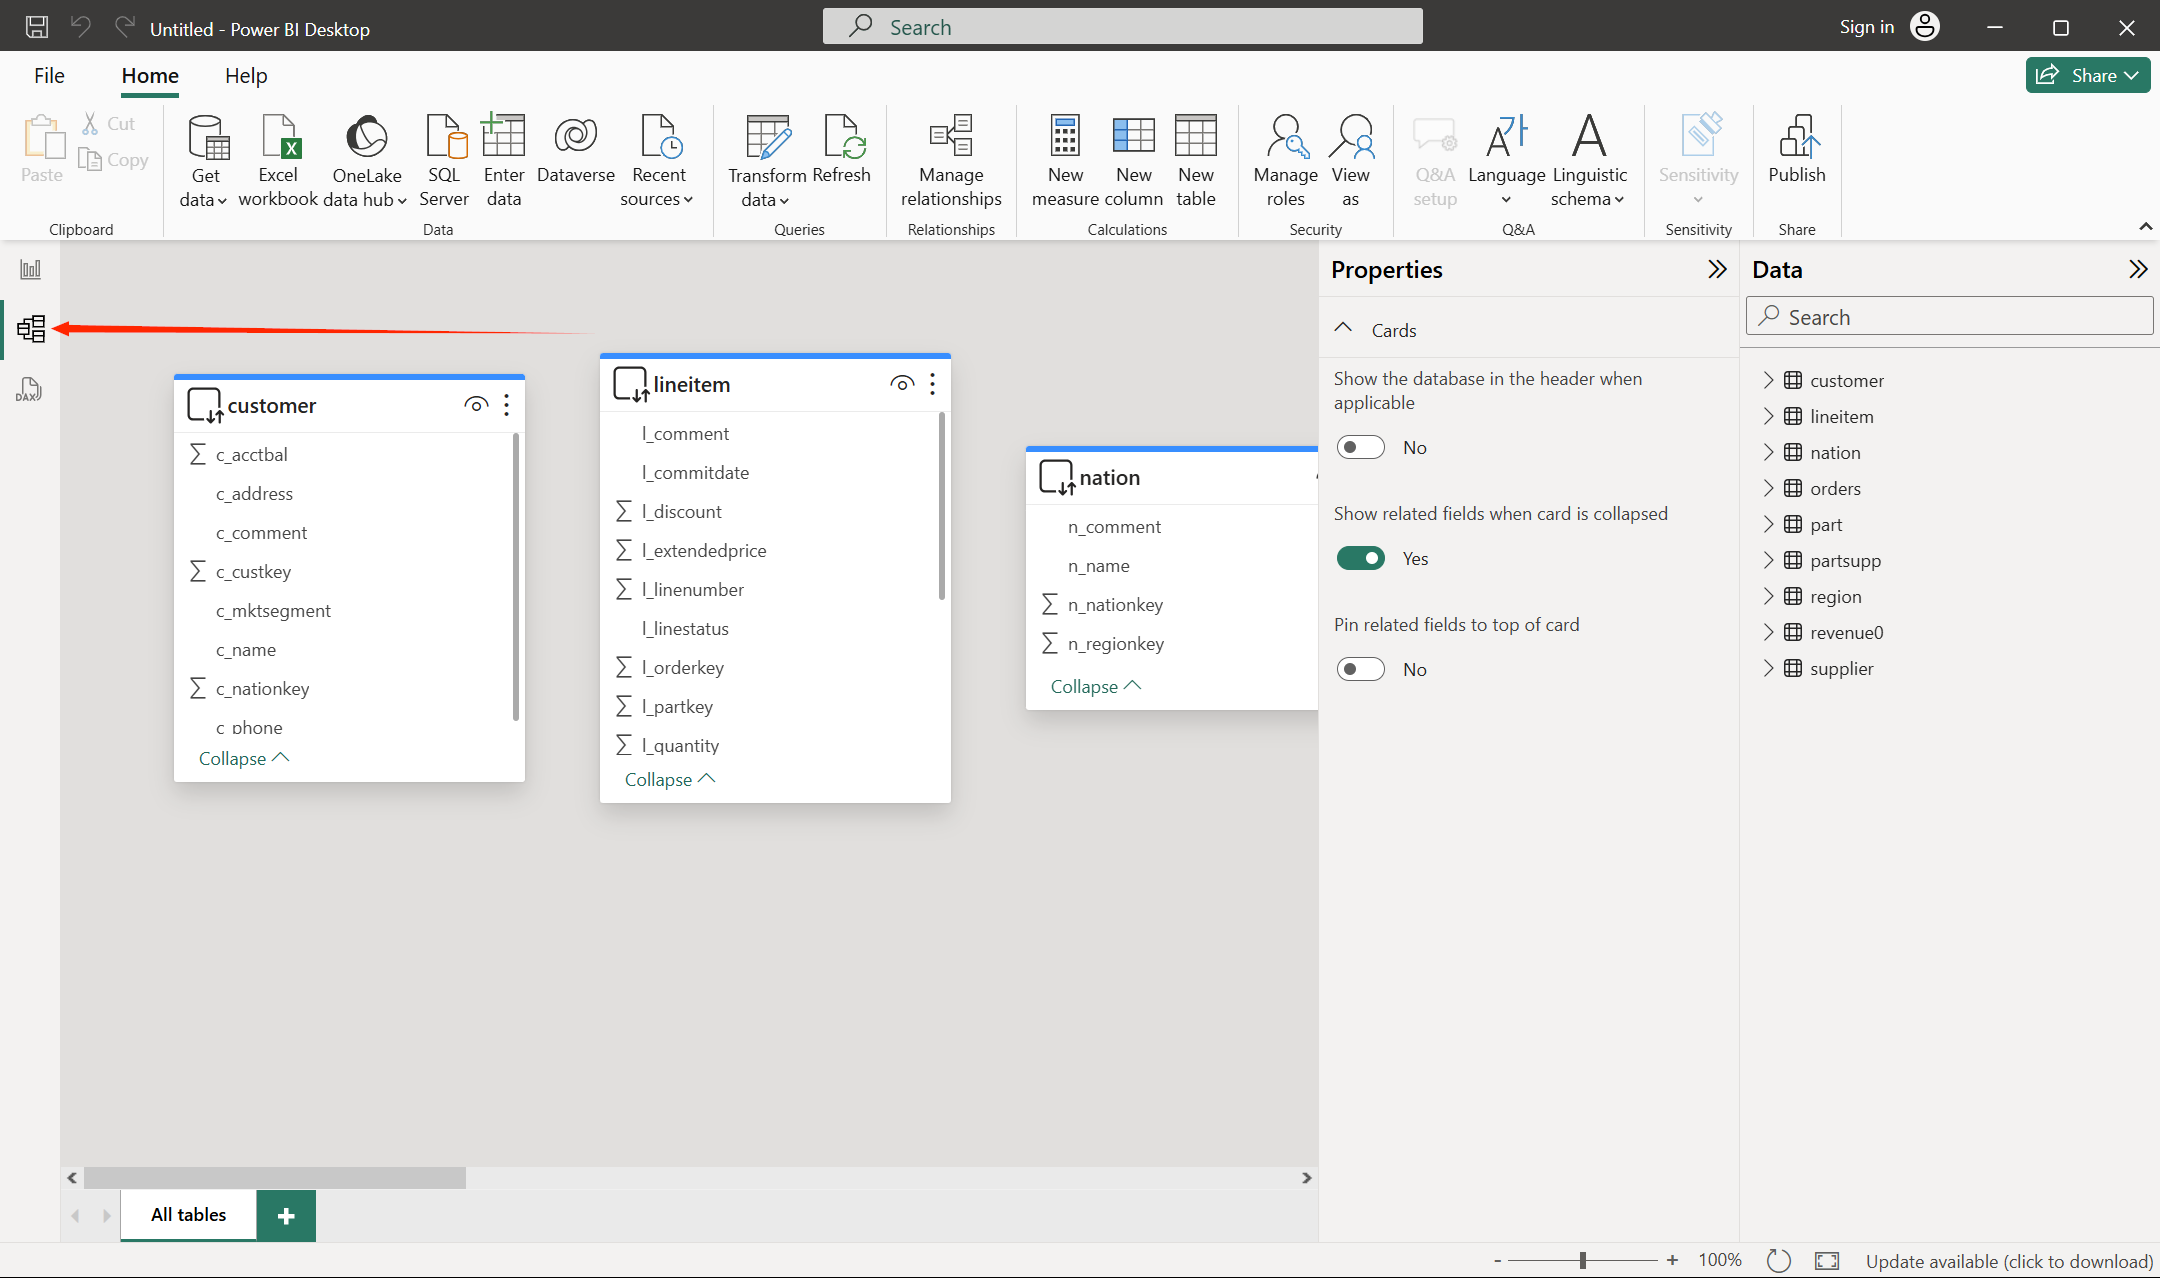
- Drag the four tables
customer,nation,orders, andregiononto the same screen as needed, and then drag the related fields to connect them.
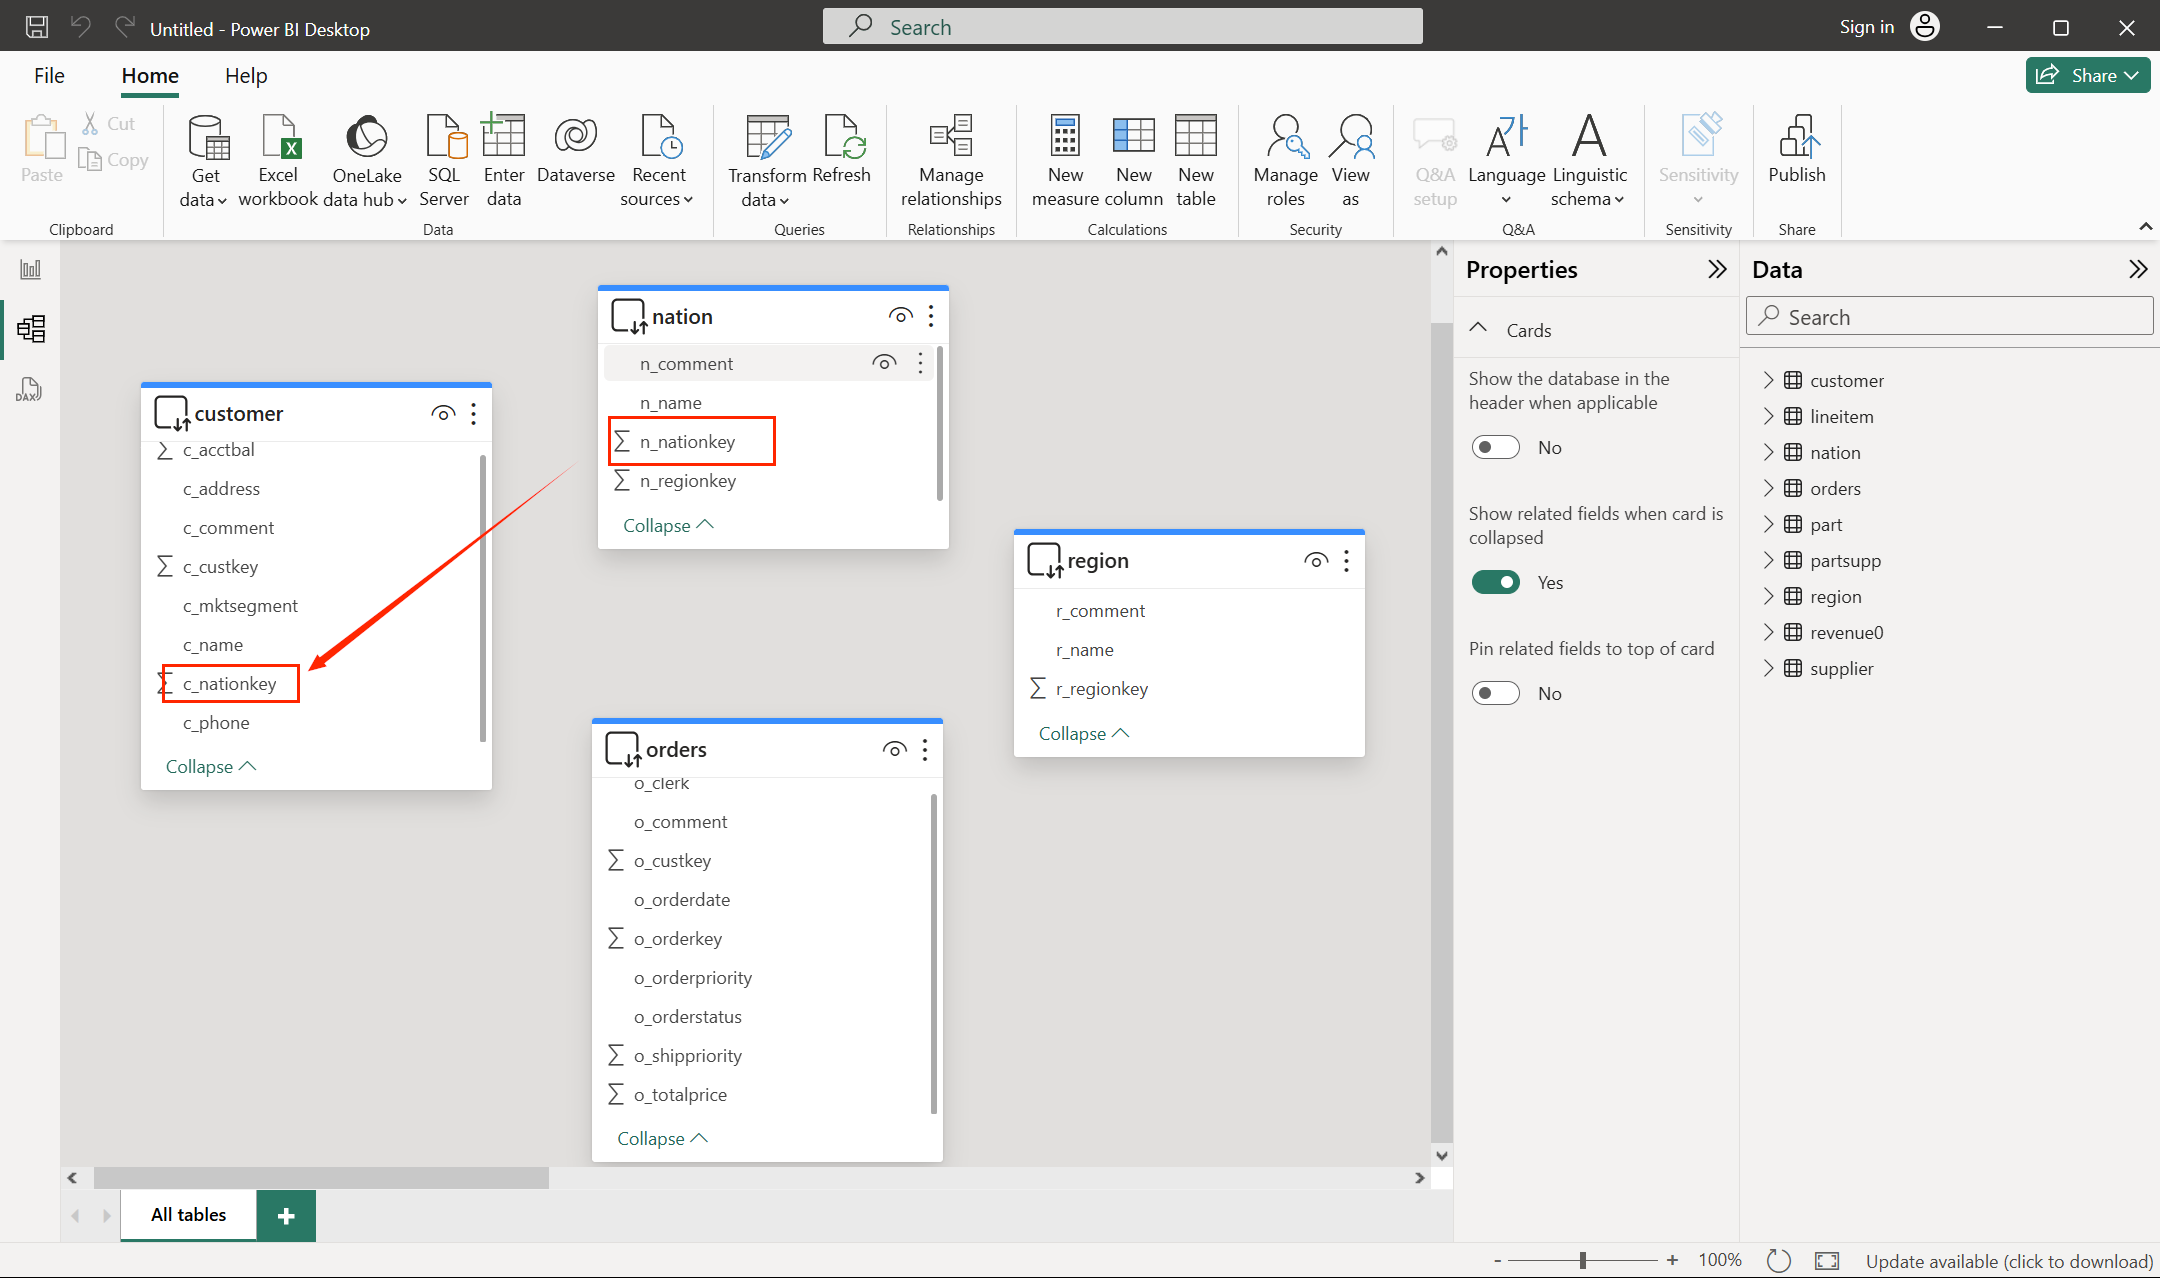
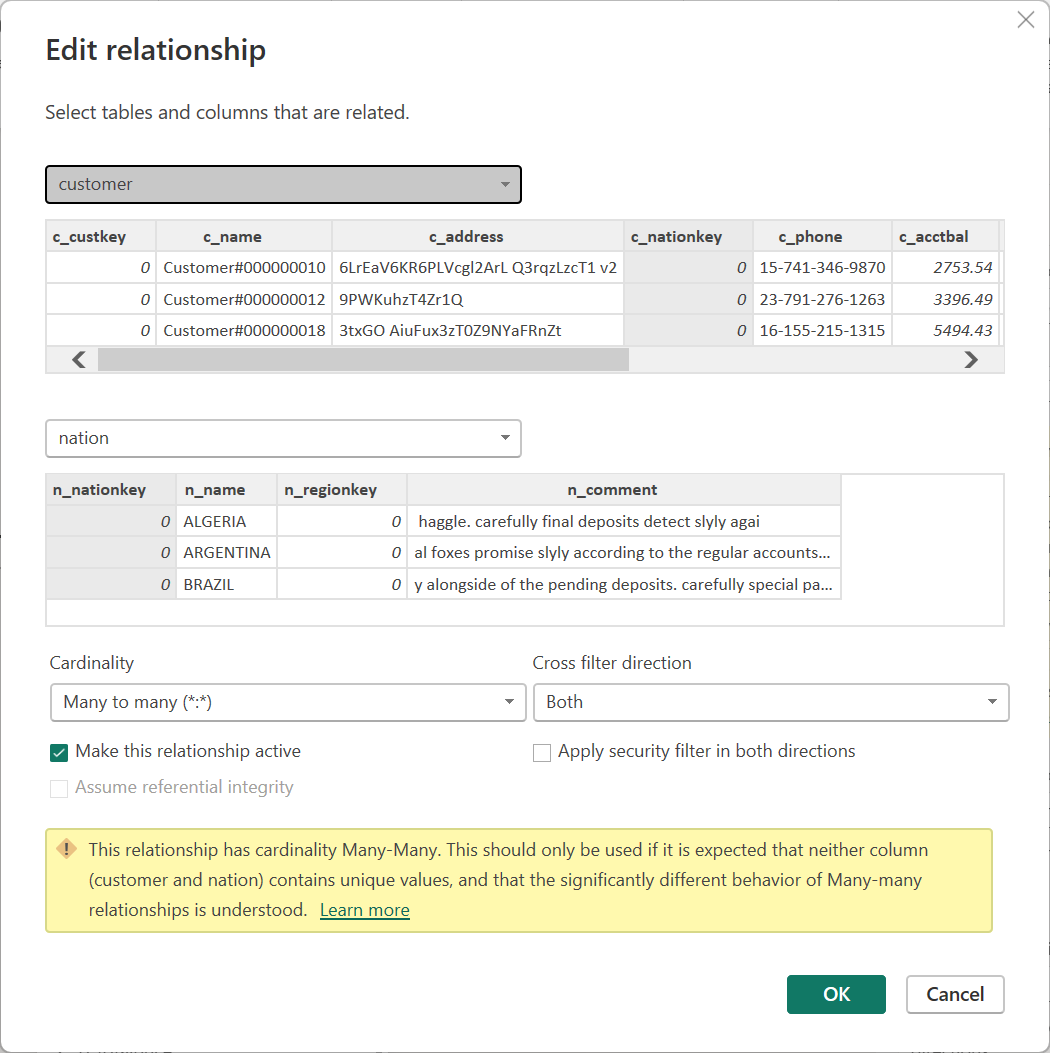
The relationships among the four tables are as follows:
| Source table | Source field | Target table | Target field |
|---|---|---|---|
customer | c_nationkey | nation | n_nationkey |
customer | c_custkey | orders | o_custkey |
nation | n_regionkey | region | r_regionkey |
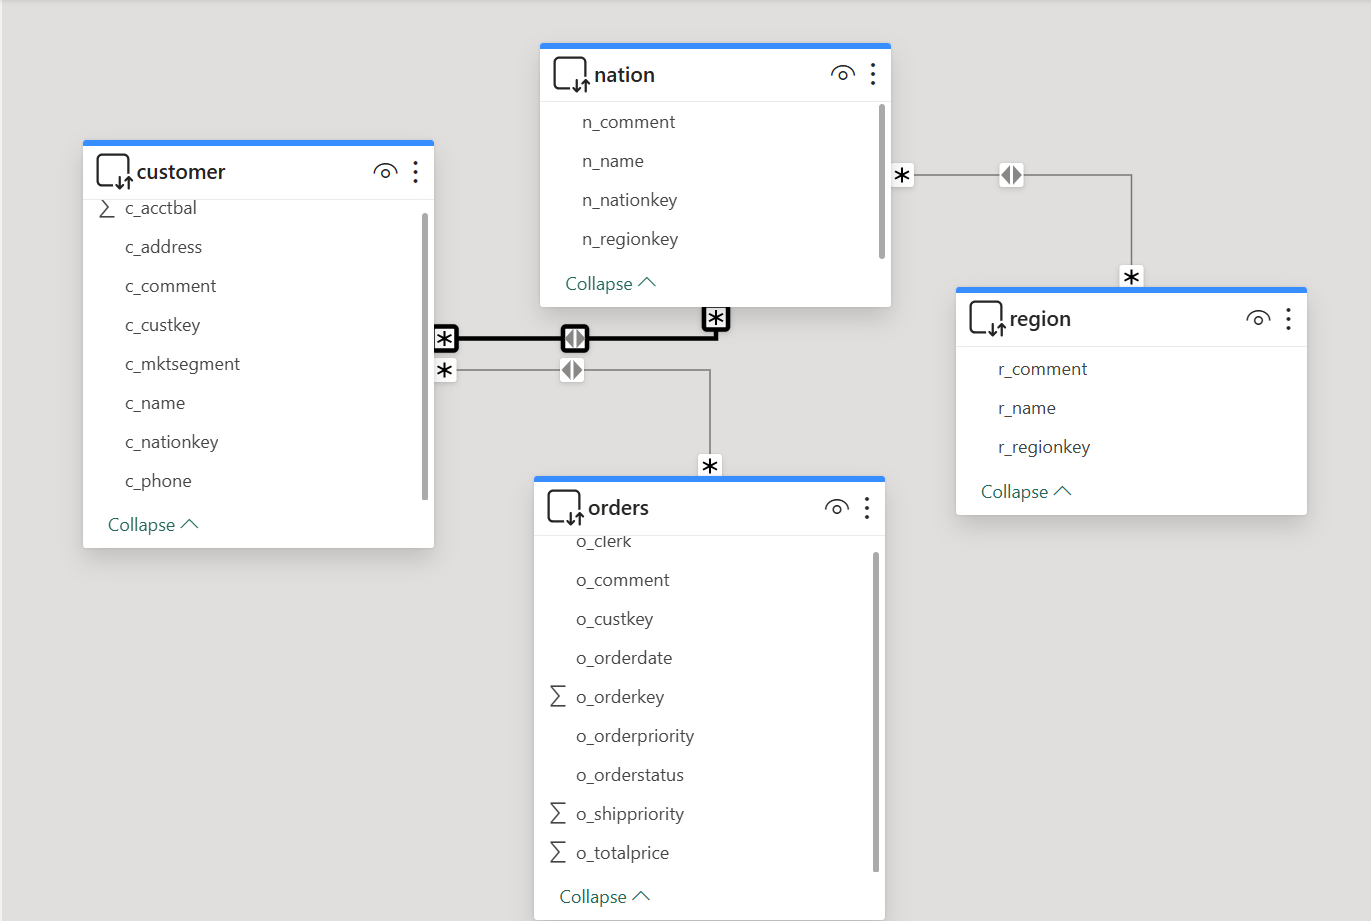
- After the relationships are set up, the result is as follows.
Configure the order revenue dashboard
-
Return to the Report view workspace and start building the dashboard.
-
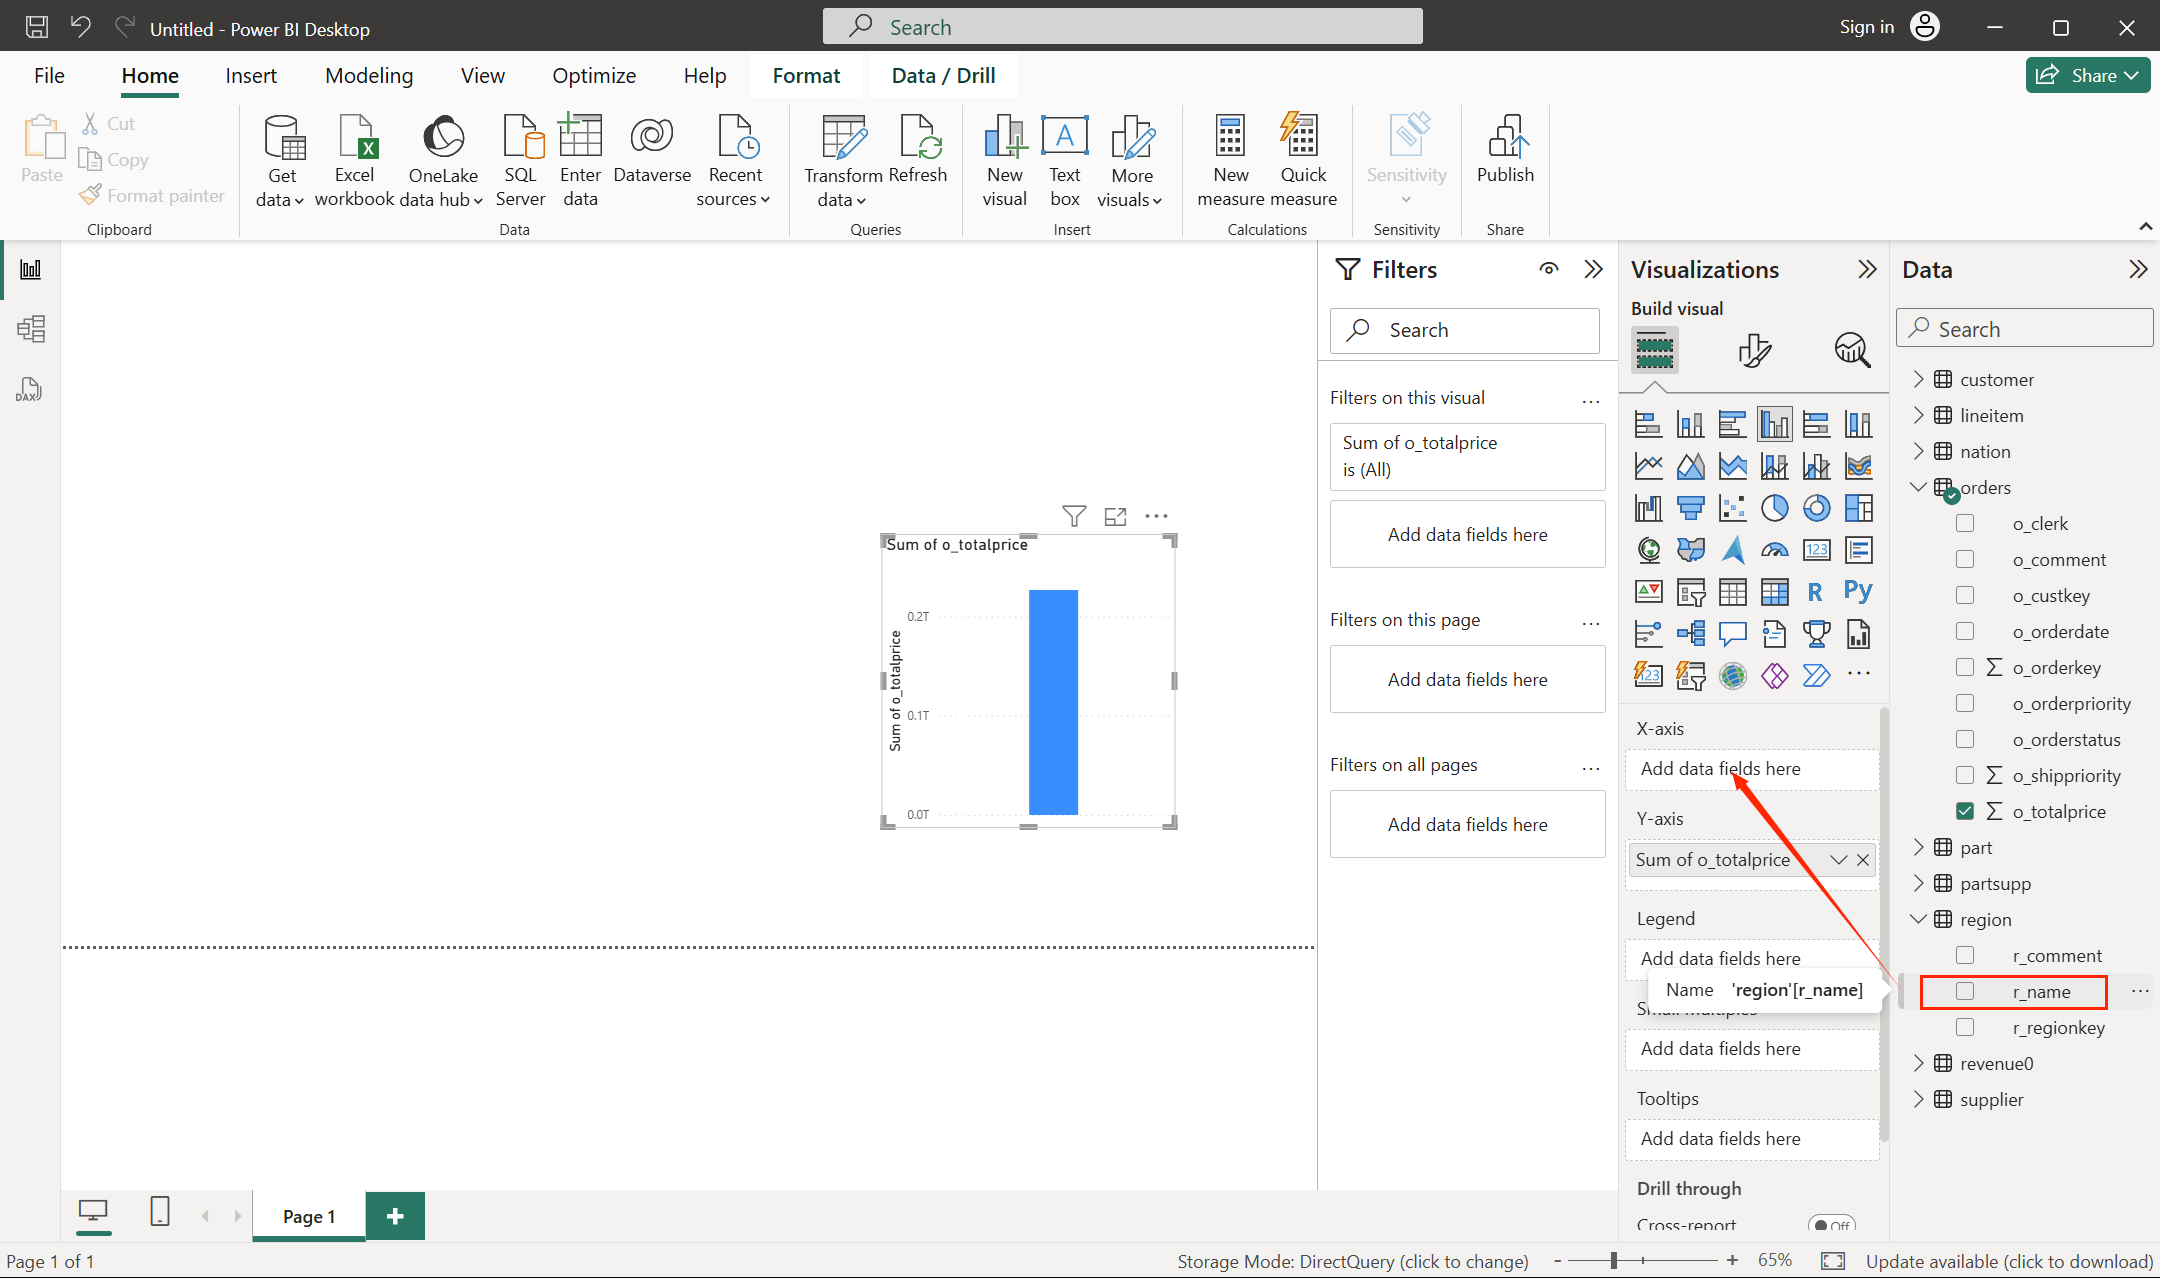
Drag
o_totalpricefrom theorderstable onto the dashboard.
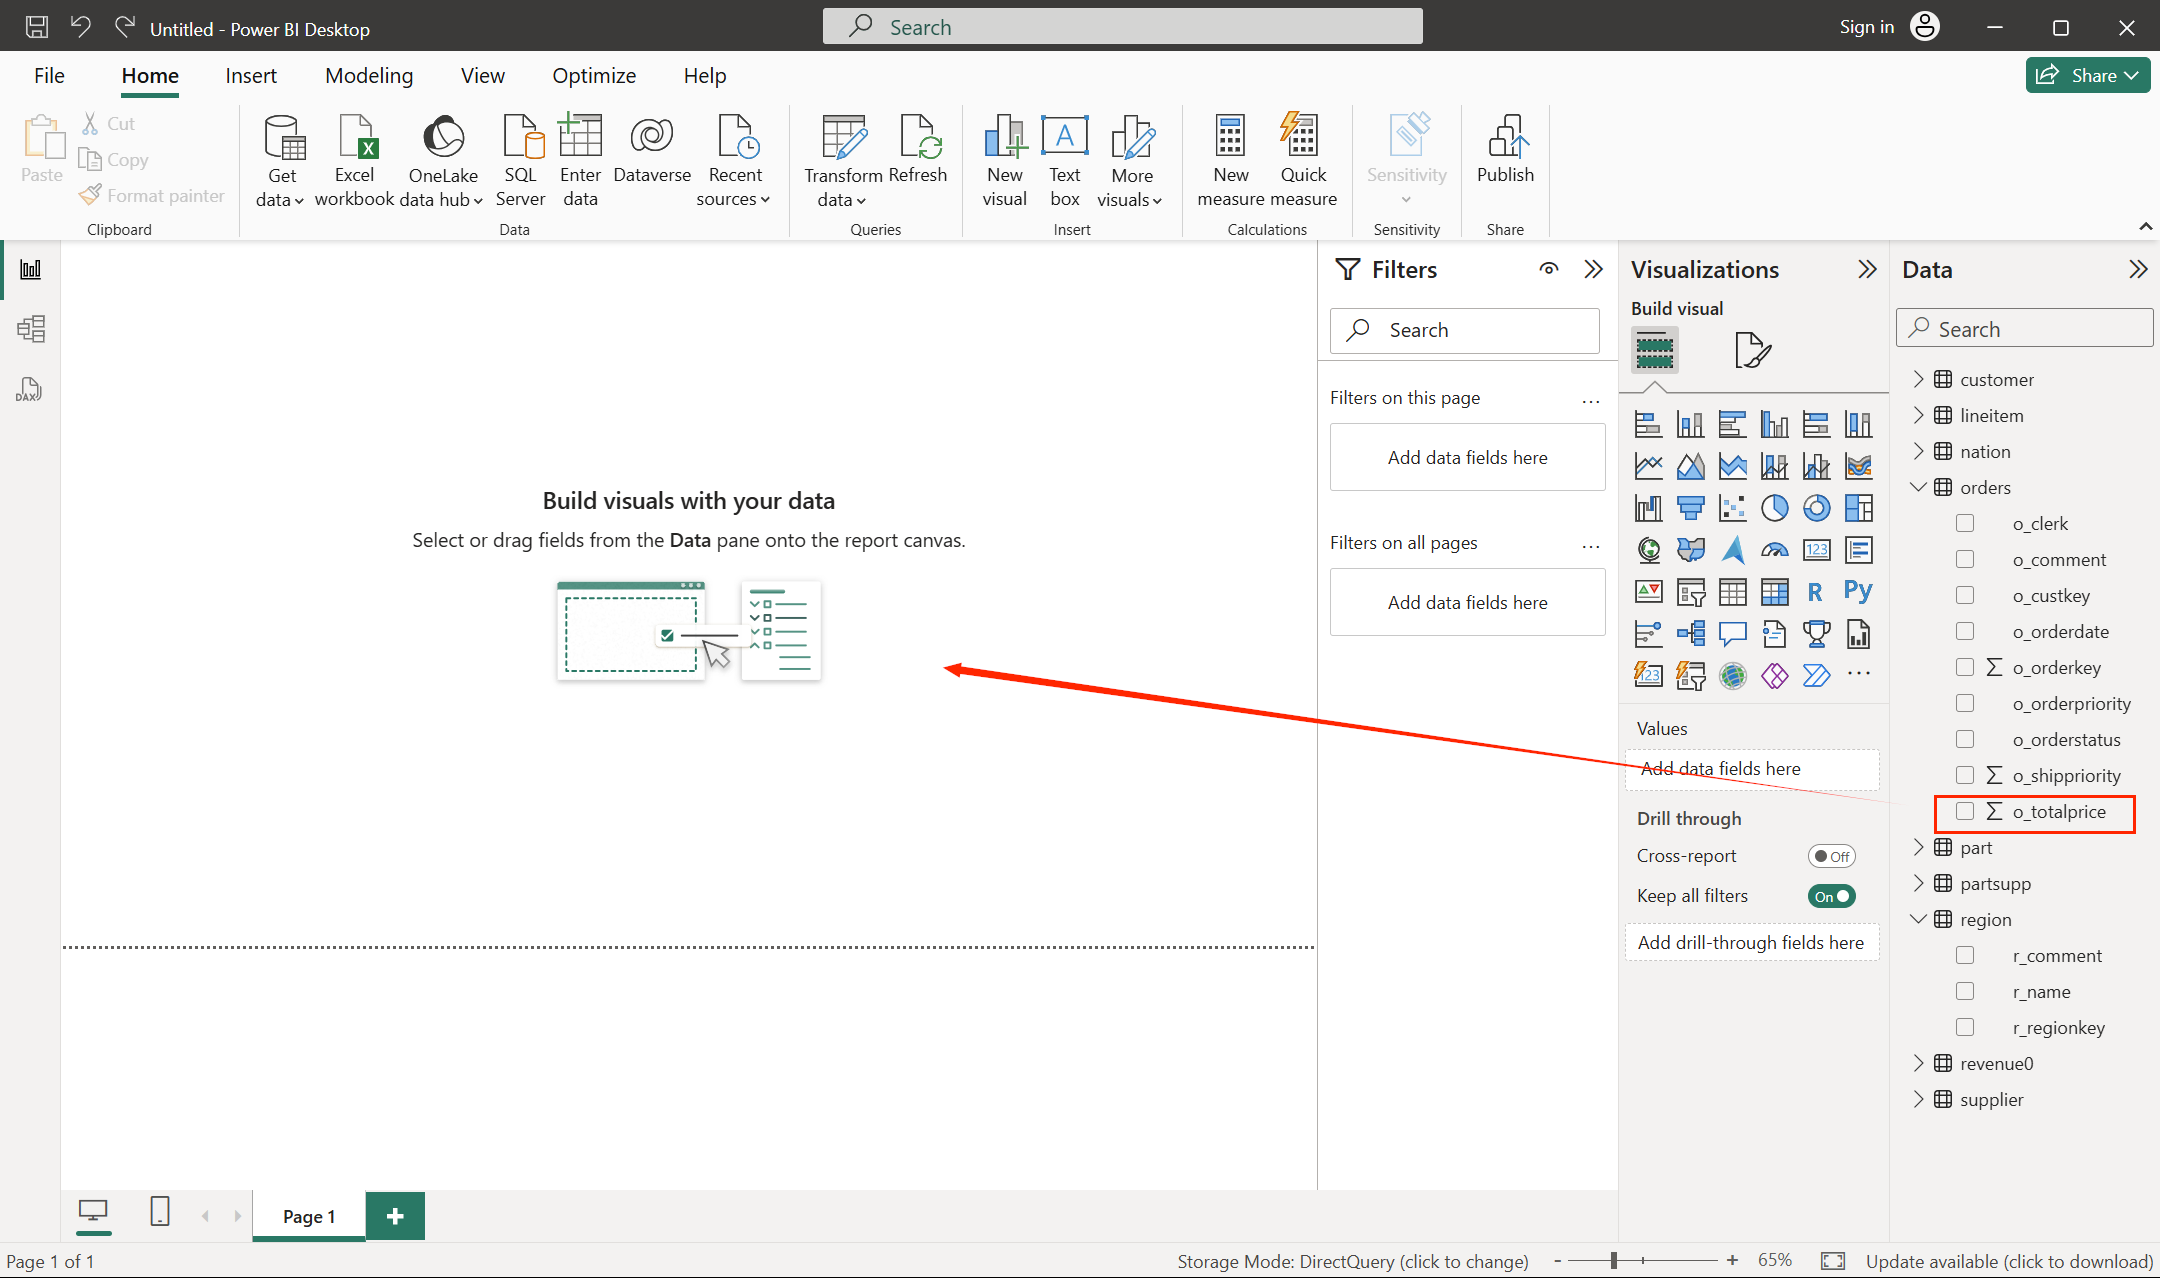
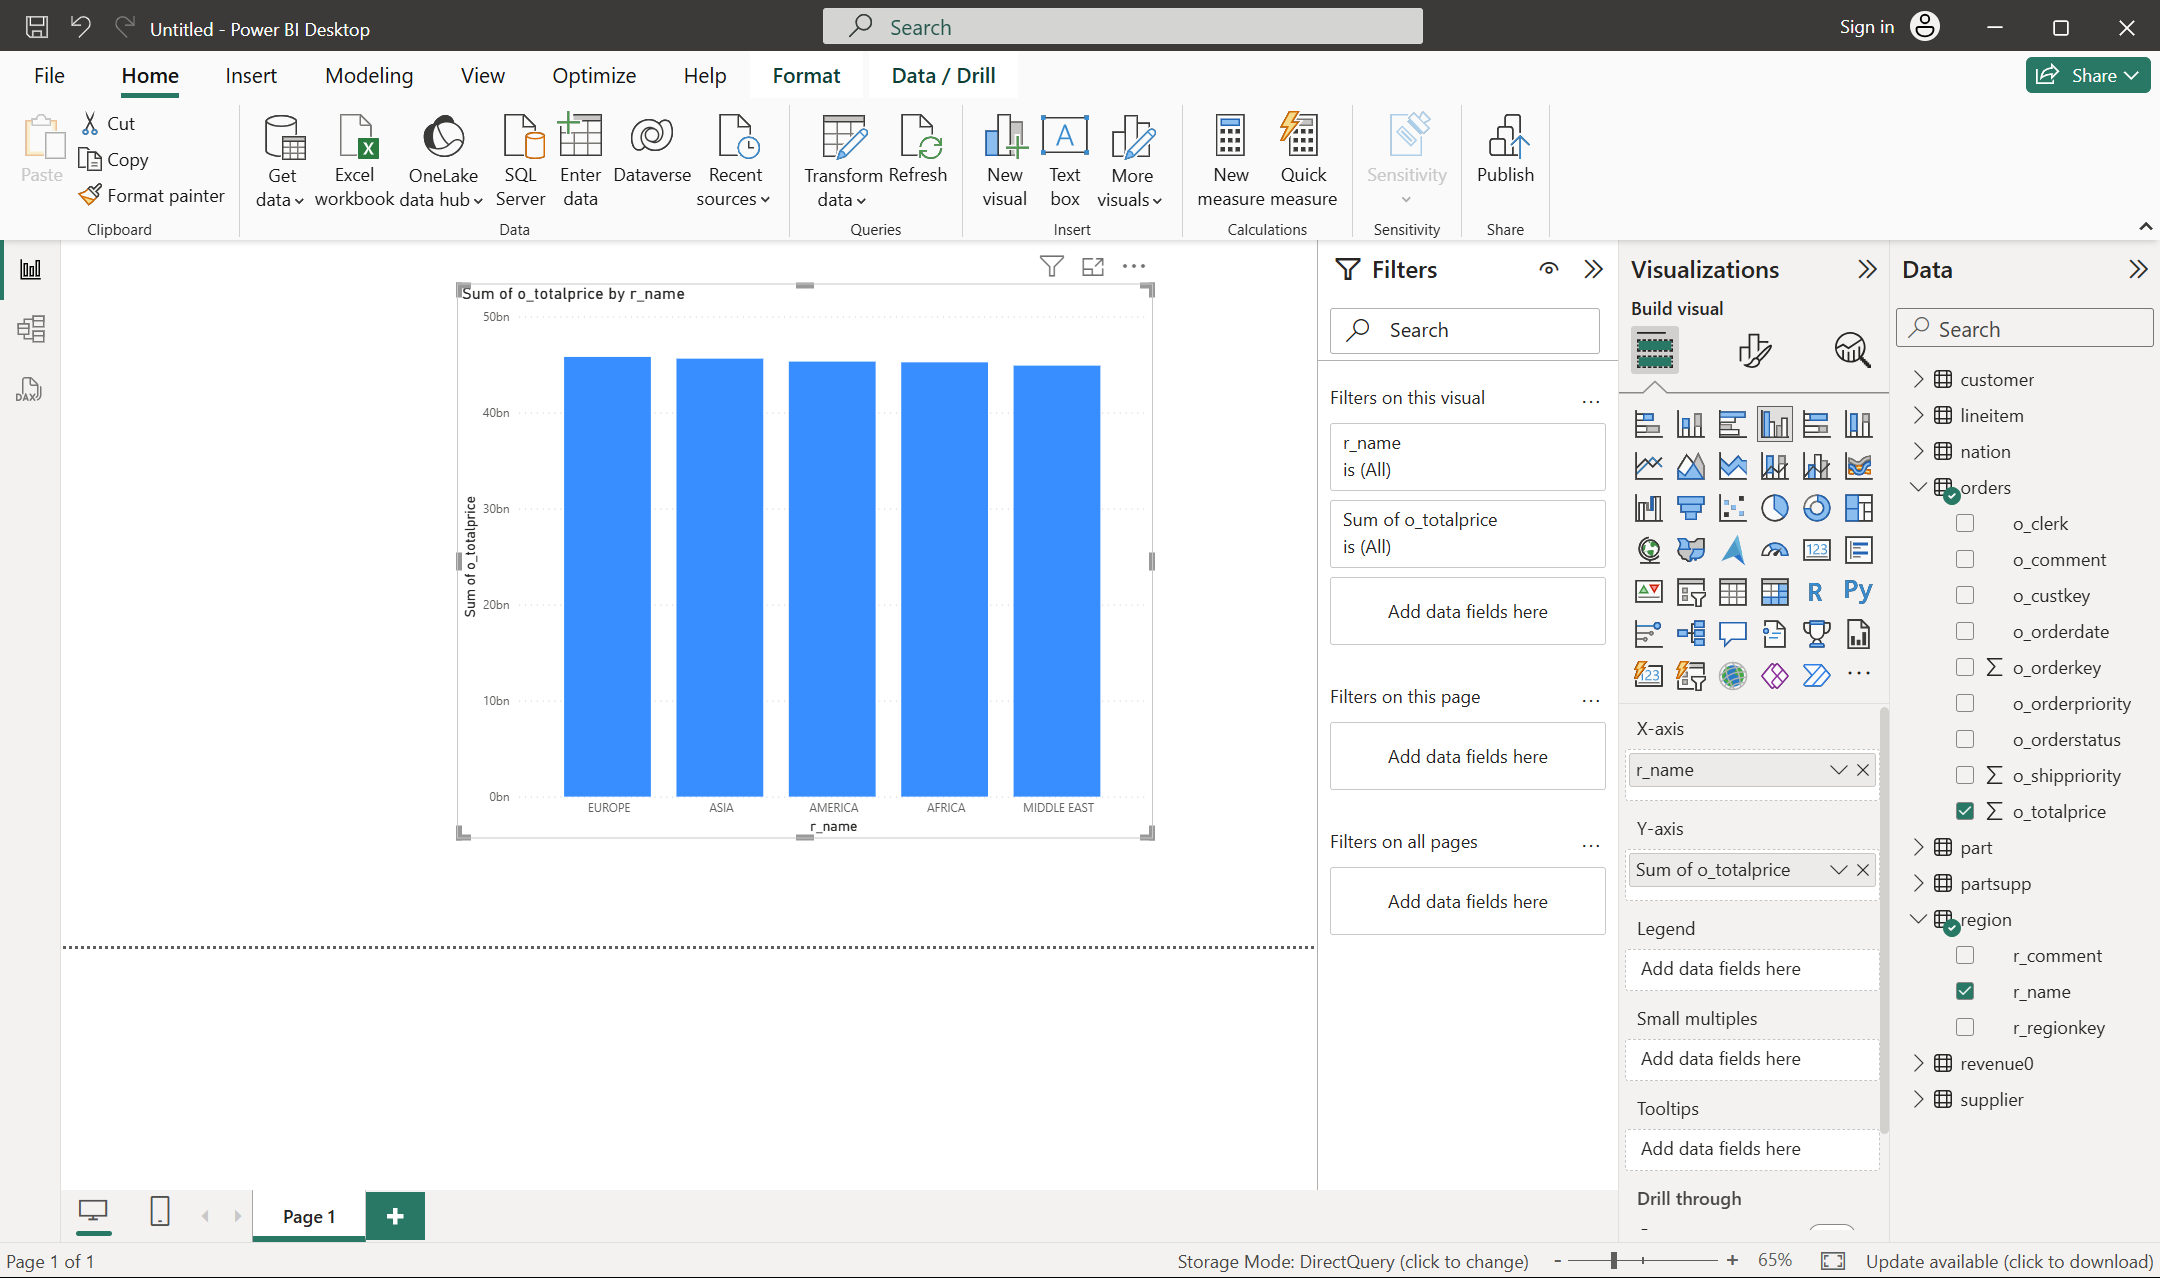
- Drag
r_namefrom theregiontable to the X column.
- The expected dashboard content is now displayed.
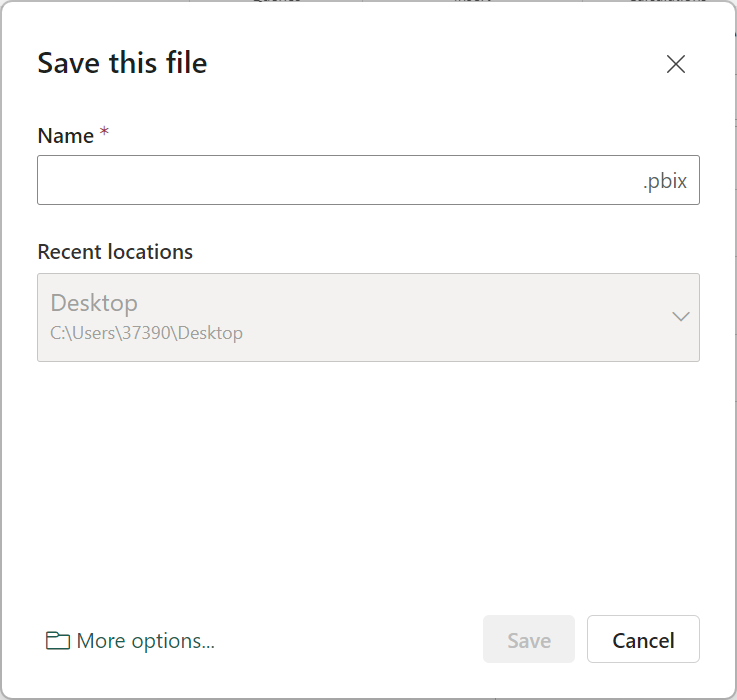
- Click the save button in the upper-left corner of the workspace to save the created statistical dashboard locally.
At this point, you have successfully connected Power BI to Apache Doris and completed data analysis and visualization dashboard creation.