
Doris OpenTelemetry Integration
Introduction
OpenTelemetry, also known as OTel, is a vendor-neutral open source Observability framework for instrumenting, generating, collecting, and exporting telemetry data such as traces, metrics, and logs. OpenTelemetry defines a set of standards and protocols for observability, widely adopted by the observability community and vendors, gradually becoming the de facto standard in the field of observability.
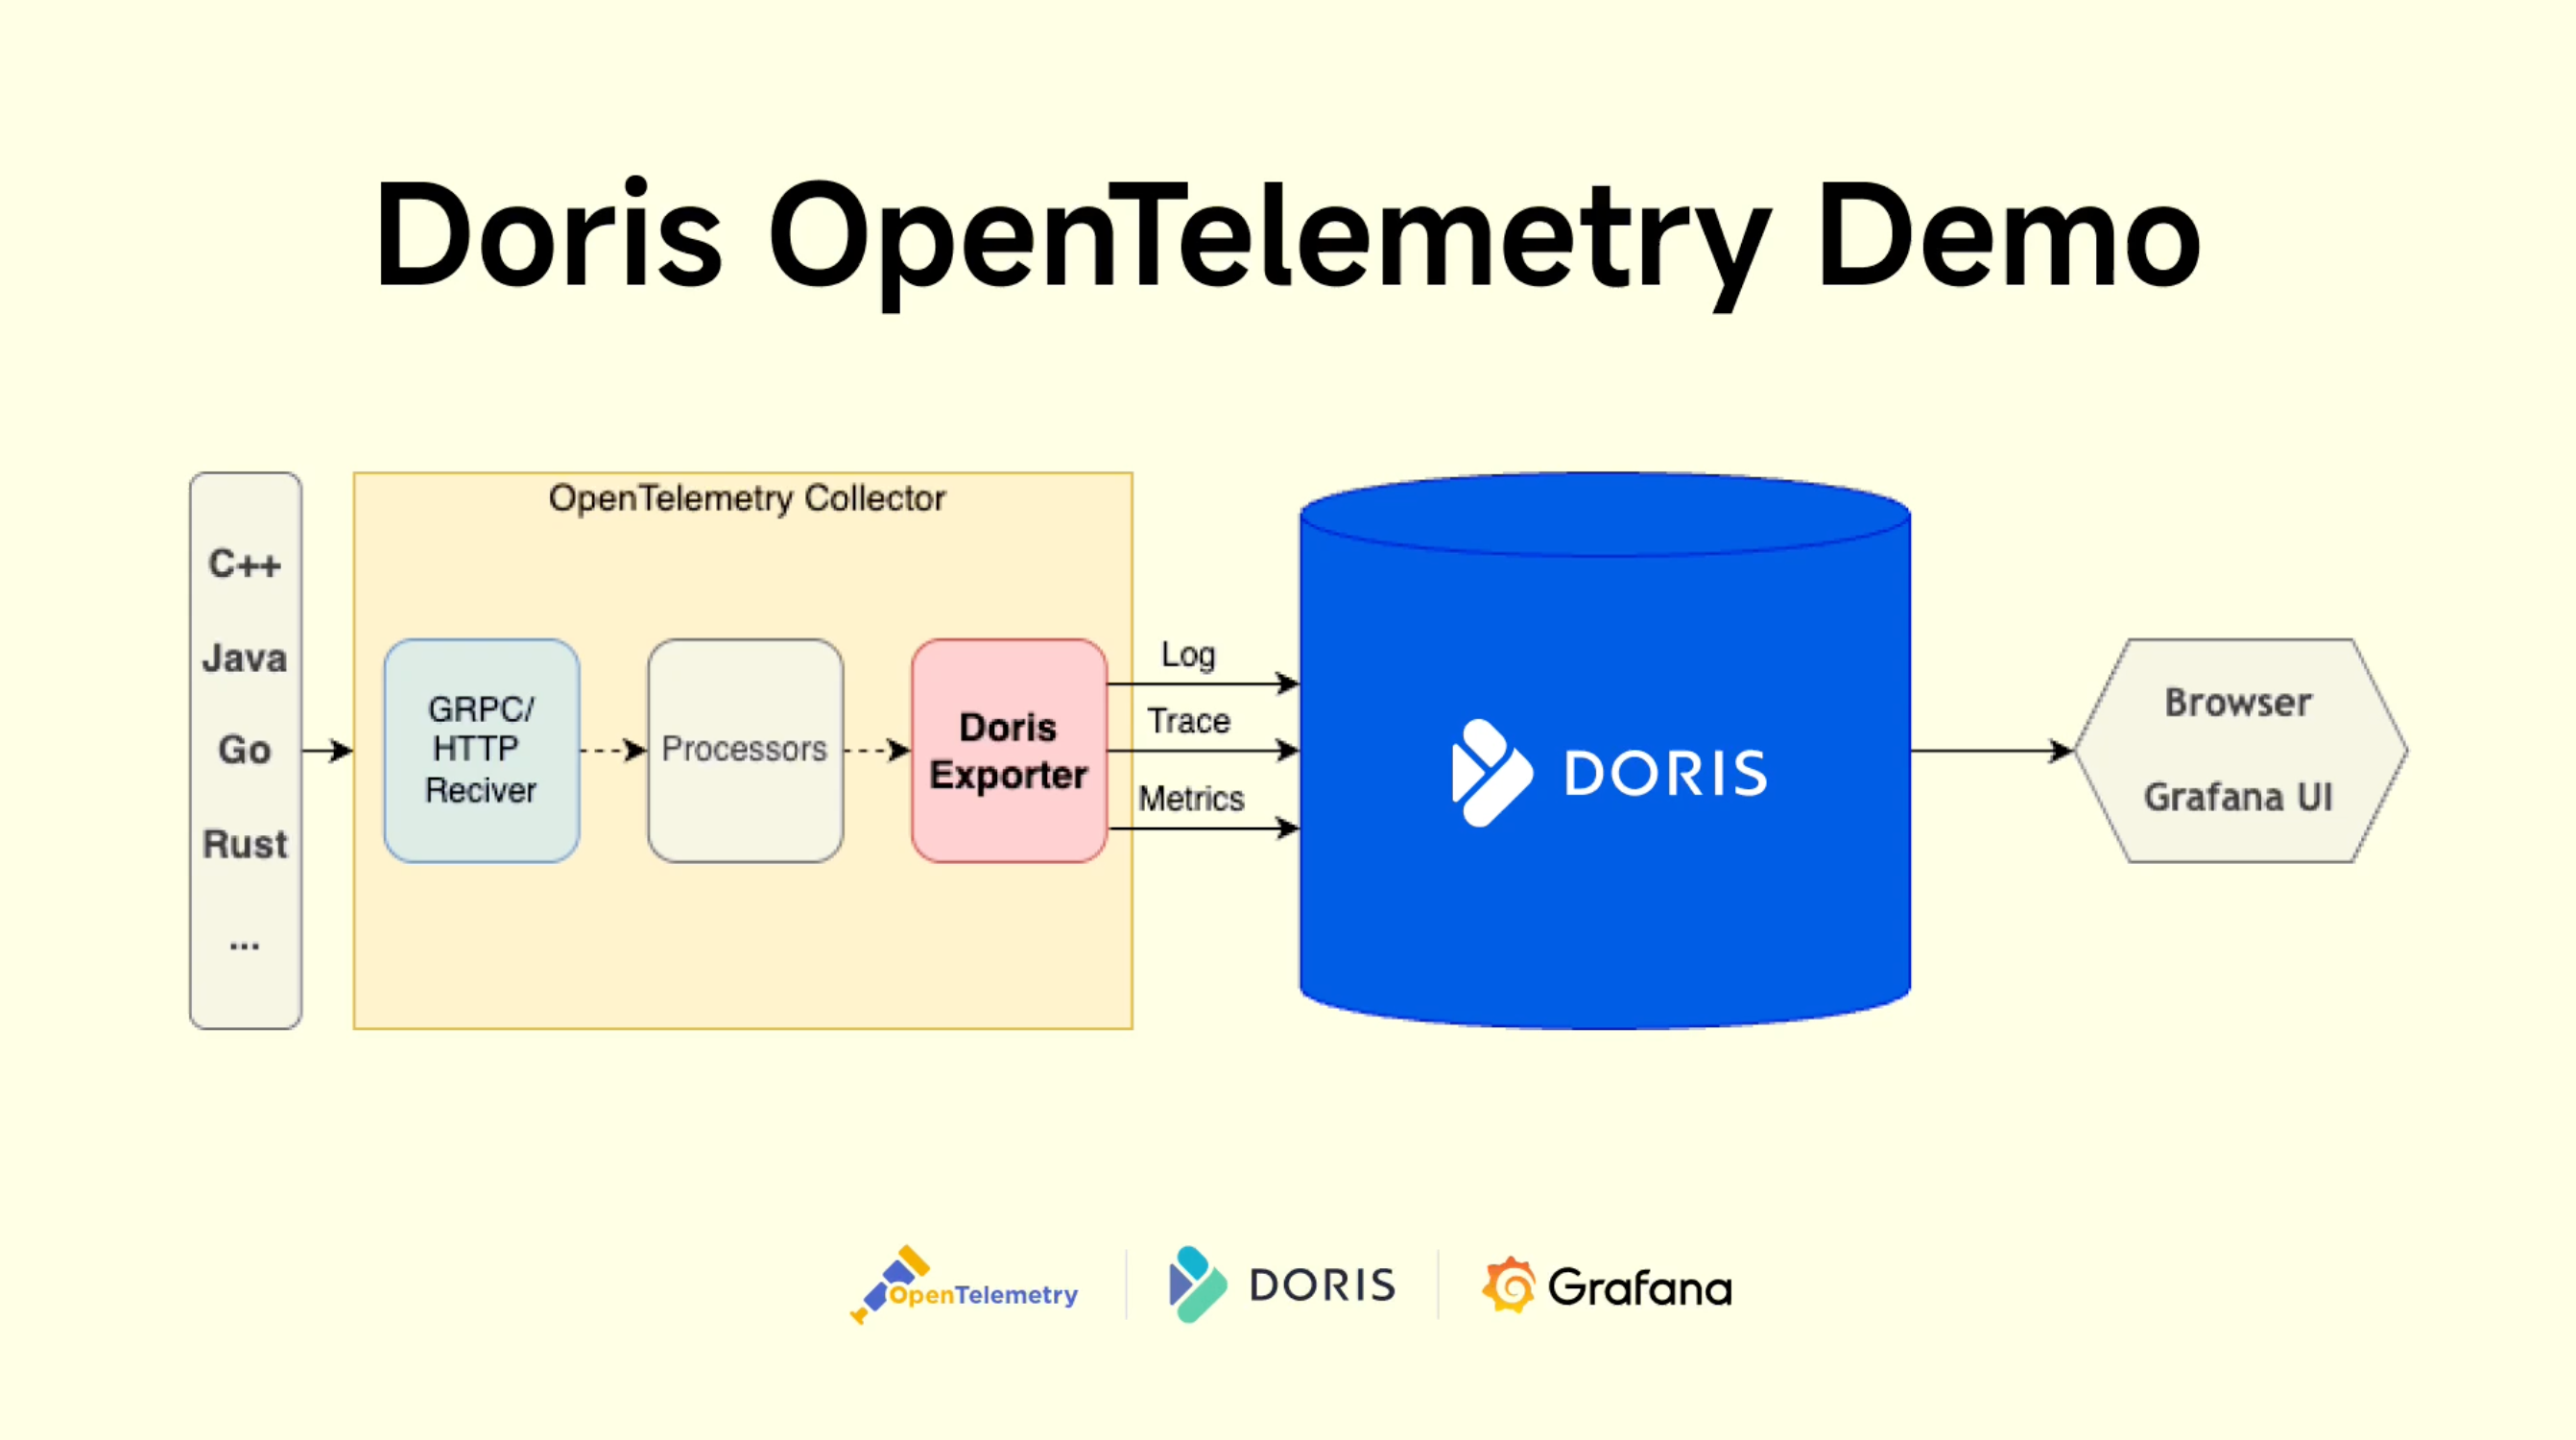
A major goal of OpenTelemetry is to enable easy instrumentation of your applications and systems, regardless of the programming language, infrastructure, and runtime environments used. The backend (storage) and the frontend (visualization) of telemetry data are intentionally left to other tools. Doris, as a storage backend integrated with OpenTelemetry, provides high-performance, low-cost, unified observability data storage and analysis capabilities. The overall architecture is as follows:
Installation
Download the OpenTelemetry Collector Contrib installation package from the OpenTelemetry official Release page, for example:
https://github.com/open-telemetry/opentelemetry-collector-releases/releases/download/v0.132.2/otelcol-contrib_0.132.2_linux_amd64.tar.gz
Extract the package to obtain the otelcol-contrib executable file.
Parameter Configuration
The core configuration of the OpenTelemetry Collector Doris Exporter is as follows:
| Configuration | Description |
|---|---|
endpoint | Doris FE HTTP address in the format host:port, e.g., "127.0.0.1:8030" |
mysql_endpoint | Doris FE MySQL address in the format host:port, e.g., "127.0.0.1:9030" |
username | Doris username with write permissions for the corresponding database tables |
password | Password for the Doris user |
database | Target Doris database name |
table.logs | Doris table name for logs data (default: otel_logs) |
table.traces | Doris table name for traces data (default: otel_traces) |
table.metrics | Doris table name for metrics data (default: otel_metrics) |
create_schema | Whether to automatically create Doris database tables (default: true) |
history_days | Retention days for historical data in auto-created tables (default: 0, meaning permanent retention) |
create_history_days | Initial partition days for auto-created tables (default: 0, meaning no partitions created) |
label_prefix | Doris Stream Load Label prefix. The final label is {label_prefix}_{db}_{table}_{yyyymmdd_hhmmss}_{uuid} (default: open_telemetry) |
headers | Headers for Doris Stream Load in YAML map format |
log_progress_interval | Interval (in seconds) for logging throughput (default: 10, set to 0 to disable) |
For more configurations, refer to:
https://github.com/open-telemetry/opentelemetry-collector-contrib/tree/main/exporter/dorisexporter
Usage Example
Usage Example
TEXT Log Collection Example
This example demonstrates TEXT log collection using Doris FE logs.
1. Data
FE log files are typically located in the fe/log/fe.log file under the Doris installation directory. These are standard Java program logs, including fields such as timestamps, log levels, thread names, code locations, and log content. In addition to normal logs, there are also exception logs with stack traces. Since stack traces span multiple lines, the log collection and storage process must combine the main log and stack trace into a single log entry.
Example logs:
2024-07-08 21:18:01,432 INFO (Statistics Job Appender|61) [StatisticsJobAppender.runAfterCatalogReady():70] Stats table not available, skip
2024-07-08 21:18:53,710 WARN (STATS_FETCH-0|208) [StmtExecutor.executeInternalQuery():3332] Failed to run internal SQL: OriginStatement{originStmt='SELECT * FROM __internal_schema.column_statistics WHERE part_id is NULL  ORDER BY update_time DESC LIMIT 500000', idx=0}
org.apache.doris.common.UserException: errCode = 2, detailMessage = tablet 10031 has no queryable replicas. err: replica 10032's backend 10008 does not exist or not alive
        at org.apache.doris.planner.OlapScanNode.addScanRangeLocations(OlapScanNode.java:931) ~[doris-fe.jar:1.2-SNAPSHOT]
        at org.apache.doris.planner.OlapScanNode.computeTabletInfo(OlapScanNode.java:1197) ~[doris-fe.jar:1.2-SNAPSHOT]
2. OpenTelemetry Configuration
The log collection configuration file (e.g., opentelemetry_java_log.yml) consists of three main parts, corresponding to the ETL process:
- Receivers – Read raw data.
- Processors – Transform data.
- Exporters – Output data.
Example configuration (opentelemetry_java_log.yml):
# 1. Receivers – Read raw data
# The `filelog` receiver reads log files from the local filesystem.
# The `multiline` configuration merges stack traces with the main log by matching timestamps.
receivers:
  filelog:
    include:
      - /path/to/fe.log
    start_at: beginning
    multiline:
      line_start_pattern: '^\d{4}-\d{2}-\d{2} \d{2}:\d{2}:\d{2},\d{3}'  # Match timestamp as new log start
    operators:
      # Parse logs
      - type: regex_parser
        regex: '^(?P<time>\d{4}-\d{2}-\d{2} \d{2}:\d{2}:\d{2},\d{3}) (?P<severity>INFO|WARN|ERROR) (?P<message>.*)'
        timestamp:
          parse_from: attributes.time
          layout: '%Y-%m-%d %H:%M:%S,%f'
        severity:
          parse_from: attributes.severity
          trace: TRACE
          debug: DEBUG
          info: INFO
          warn: WARN
          error: ERROR
          fatal: FATAL

# 2. Processors – Transform data
# The `batch` processor groups logs before sending.
processors:
  batch:
    send_batch_size: 100000  # Number of logs per batch (recommended batch size: 100MB–1GB)
    timeout: 10s

# 3. Exporters – Output data
# The `doris` exporter sends data to Doris using the Stream Load HTTP interface (JSON format by default).
exporters:
  doris:
    endpoint: http://localhost:8030  # FE HTTP address
    mysql_endpoint: localhost:9030   # FE MySQL address
    database: doris_db_name
    username: doris_username
    password: doris_password
    table:
      logs: otel_logs
    create_schema: true  # Automatically create schema (if false, tables must be created manually)
    history_days: 10
    create_history_days: 10
    timezone: Asia/Shanghai
    timeout: 60s  # HTTP Stream Load client timeout
    log_response: true
    sending_queue:
      enabled: true
      num_consumers: 20
      queue_size: 1000
    retry_on_failure:
      enabled: true
      initial_interval: 5s
      max_interval: 30s
    headers:
      load_to_single_tablet: "true"

service:
  pipelines:
    logs:
      receivers: [filelog]
      processors: [batch]
      exporters: [doris]
3. Running OpenTelemetry
./otelcol-contrib --config config/opentelemetry_java_log.yml

# When `log_response` is true, logs will display Stream Load request/response details:
2025-08-18T00:33:22.543+0800	info	dorisexporter@v0.132.0/exporter_logs.go:181	log response:
{
    "TxnId": 52,
    "Label": "open_telemetry_otel_otel_logs_20250818003321_498bb8ec-040c-4982-9eb4-452b15129782",
    "Comment": "",
    "TwoPhaseCommit": "false",
    "Status": "Success",
    "Message": "OK",
    "NumberTotalRows": 50355,
    "NumberLoadedRows": 50355,
    "NumberFilteredRows": 0,
    "NumberUnselectedRows": 0,
    "LoadBytes": 31130235,
    "LoadTimeMs": 680,
    "BeginTxnTimeMs": 0,
    "StreamLoadPutTimeMs": 3,
    "ReadDataTimeMs": 106,
    "WriteDataTimeMs": 653,
    "ReceiveDataTimeMs": 11,
    "CommitAndPublishTimeMs": 23
}

# Progress logs (every 10s) show throughput:
2025-08-18T00:05:00.017+0800	info	dorisexporter@v0.132.0/progress_reporter.go:63	[LOG] total 11 MB 18978 ROWS, total speed 0 MB/s 632 R/s, last 10 seconds speed 1 MB/s 1897 R/s
JSON Log Collection Example
This example demonstrates JSON log collection using GitHub Events Archive data.
1. Data
GitHub Events Archive contains archived user activity events in JSON format, downloadable from https://www.gharchive.org/. For example, to download data from January 1, 2024, at 15:00:
wget https://data.gharchive.org/2024-01-01-15.json.gz
Below is a sample entry (formatted for readability; actual data is one JSON object per line):
{
  "id": "37066529221",
  "type": "PushEvent",
  "actor": {
    "id": 46139131,
    "login": "Bard89",
    "display_login": "Bard89",
    "gravatar_id": "",
    "url": "https://api.github.com/users/Bard89",
    "avatar_url": "https://avatars.githubusercontent.com/u/46139131?"
  },
  "repo": {
    "id": 780125623,
    "name": "Bard89/talk-to-me",
    "url": "https://api.github.com/repos/Bard89/talk-to-me"
  },
  "payload": {
    "repository_id": 780125623,
    "push_id": 17799451992,
    "size": 1,
    "distinct_size": 1,
    "ref": "refs/heads/add_mvcs",
    "head": "f03baa2de66f88f5f1754ce3fa30972667f87e81",
    "before": "85e6544ede4ae3f132fe2f5f1ce0ce35a3169d21"
  },
  "public": true,
  "created_at": "2024-04-01T23:00:00Z"
}
2. OpenTelemetry Configuration
The key difference from the TEXT log configuration is the json_parser operator in the filelog receiver, which parses each line as JSON. Extracted fields are used for subsequent processing.
Example configuration (opentelemetry_json_log.yml):
receivers:
  filelog:
    include:
      - /path/to/2024-01-01-15.json
    start_at: beginning
    operators:
      - type: json_parser
        timestamp:
          parse_from: attributes.created_at
          layout: '%Y-%m-%dT%H:%M:%SZ'

processors:
  batch:
    send_batch_size: 100000  # Logs per batch (recommended: 100MB–1GB total size)
    timeout: 10s

exporters:
  doris:
    endpoint: http://localhost:8030  # FE HTTP address
    mysql_endpoint: localhost:9030   # FE MySQL address
    database: doris_db_name
    username: doris_username
    password: doris_password
    table:
      logs: otel_logs
    create_schema: true  # Auto-create schema (if false, manually create tables)
    history_days: 10
    create_history_days: 10
    timezone: Asia/Shanghai
    timeout: 60s  # HTTP Stream Load client timeout
    log_response: true
    sending_queue:
      enabled: true
      num_consumers: 20
      queue_size: 1000
    retry_on_failure:
      enabled: true
      initial_interval: 5s
      max_interval: 30s
    headers:
      load_to_single_tablet: "true"

service:
  pipelines:
    logs:
      receivers: [filelog]
      processors: [batch]
      exporters: [doris]
3. Running OpenTelemetry
./otelcol-contrib --config config/opentelemetry_json_log.yml
Trace Collection Example
1. OpenTelemetry Configuration
Create the configuration file otel_trace.yml as follows:
receivers:
  otlp:  # OTLP protocol to receive data from OpenTelemetry Java Agent
    protocols:
      grpc:
        endpoint: 0.0.0.0:4317
      http:
        endpoint: 0.0.0.0:4318

processors:
  batch:
    send_batch_size: 100000  # Number of traces per batch (recommended batch size: 100MB–1GB)
    timeout: 10s

exporters:
  doris:
    endpoint: http://localhost:8030  # FE HTTP address
    database: doris_db_name
    username: doris_username
    password: doris_password
    table:
      traces: doris_table_name
    create_schema: true  # Auto-create schema (if false, tables must be created manually)
    mysql_endpoint: localhost:9030  # FE MySQL address
    history_days: 10
    create_history_days: 10
    timezone: Asia/Shanghai
    timeout: 60s  # HTTP Stream Load client timeout
    log_response: true
    sending_queue:
      enabled: true
      num_consumers: 20
      queue_size: 1000
    retry_on_failure:
      enabled: true
      initial_interval: 5s
      max_interval: 30s
    headers:
      load_to_single_tablet: "true"

service:
  pipelines:
    traces:
      receivers: [otlp]
      processors: [batch]
      exporters: [doris]
2. Run OpenTelemetry
./otelcol-contrib --config otel_trace.yaml
3. Application Integration with OpenTelemetry SDK
Here we demonstrate integration using a Spring Boot example application (from the official demo), which returns "Hello World!" for the "/" endpoint.
-
Download the OpenTelemetry Java Agent.
- Advantage: No code changes required for existing applications.
- For other languages/integration methods, see OpenTelemetry docs:
-
Before starting the application, set these environment variables (no code modification needed):
export JAVA_TOOL_OPTIONS="${JAVA_TOOL_OPTIONS} -javaagent:/your/path/to/opentelemetry-javaagent.jar"  # Path to OpenTelemetry Java Agent
export OTEL_JAVAAGENT_LOGGING="none"  # Disable OTEL logs to avoid interference with application logs
export OTEL_SERVICE_NAME="myproject"
export OTEL_TRACES_EXPORTER="otlp"  # Use OTLP protocol to send trace data
export OTEL_EXPORTER_OTLP_ENDPOINT="http://localhost:4317"  # OpenTelemetry Collector address

java -jar myproject-0.0.1-SNAPSHOT.jar