Overview
What Is Observability?
Observability refers to the ability to infer a system's internal state through its external output data. An observability platform collects, stores, and visualizes three core data: Logs, Traces, and Metrics. This helps teams gain a comprehensive understanding of the operational status of distributed systems, supports resource optimization, fault prediction, root cause analysis, improves system reliability, and enhances user experience.
Why Observability Is Becoming Increasingly Important
Observability platforms have several critical use cases that are vital for improving system stability, optimizing operations efficiency, and enabling business innovation.
-
Fault Diagnosis and Root Cause Analysis: Real-time monitoring, anomaly detection, and tracing capabilities enable quick identification and analysis of faults. For example, in the financial industry, combining observability with transaction tracing and AI technologies can shorten recovery time and ensure business continuity. It also supports chaos engineering to simulate failure scenarios and validate system fault tolerance.
-
Performance Optimization and Resource Planning: Analyzing system resource utilization and response times helps identify performance bottlenecks and dynamically adjust configurations (e.g., load balancing, auto-scaling). Historical data can be used to predict resource needs, optimize cloud resource allocation, and reduce costs.
-
Business Decision Support: Correlating IT performance data with business outcomes (such as user retention rates and transaction volumes) helps formulate business strategies. For instance, analyzing user experience metrics can guide product feature improvements.
-
Security and Compliance Monitoring: Detects abnormal behaviors (e.g., zero-day attacks) and triggers automated responses to enhance system security. At the same time, log auditing ensures compliance with regulatory requirements.
-
DevOps Collaboration: During canary releases, traffic tagging enables tracking of new version behavior. Combined with call chain analysis, it informs release progression and helps developers optimize code performance, reducing production incidents.
The growing importance of observability in recent years is mainly driven by two factors:
-
Increasing Complexity of Business and IT Systems: With the development of cloud computing and microservices, business systems are becoming increasingly complex. For example, a GenAI application request might involve dozens of services such as App, service gateway, authentication service, billing service, RAG engine, Agent engine, vector database, business database, distributed cache, message queue, and large model APIs. Traditional methods like checking server status via SSH and analyzing logs are no longer effective in such complex environments. Observability platforms unify Log, Trace, and Metric data collection and storage, providing centralized visualization and rapid issue investigation.
-
Higher Requirements for Business Reliability: System failures have increasingly high impacts on user experience. Therefore, the efficiency of fault detection and recovery has become more critical. Observability provides full data visibility and panoramic analytics, allowing teams to quickly locate root causes, reduce downtime, and ensure service availability. Moreover, with global data analytics and forecasting, potential resource bottlenecks can be identified early, preventing failures before they occur.
How to Choose an Observability Solution
Observability data has several characteristics, and addressing the challenges of massive data storage and analysis is key to any observability solution.
-
High Storage Volume and Cost Sensitivity: Observability data, especially Logs and Traces, are typically enormous in volume and generated continuously. In medium-to-large enterprises, daily data generation often reaches terabytes or even petabytes. To meet business or regulatory requirements, data must often be stored for months or even years, leading to storage volumes reaching the PB or EB scale and resulting in significant storage costs. Over time, the value of this data diminishes, making cost efficiency increasingly important.
-
High Throughput Writes with Real-Time Requirements: Handling daily ingestion of TB or PB-scale data offen requires write throughput ranging from 1–10 GB/s or millions to tens of millions of records per second. Simultaneously, due to the need for real-time troubleshooting and security investigations, platforms must support sub-second write latencies to ensure real-time data availability.
-
Real-Time Analysis and Full-Text Search Capabilities: Logs and Traces contain large amounts of textual data. Quickly searching for keywords and phrases is essential. Traditional full-scan and string-matching approaches often fail to deliver real-time performance, especially at this scale—especially under high-throughput, low-latency ingestion conditions. Thus, building inverted indexes tailored for text becomes crucial for achieving sub-second query responsiveness.
-
Dynamic Data Schema and Frequent Expansion Needs: Logs originally existed as unstructured free-text logs but evolved into semi-structured JSON formats. Producers frequently modify JSON fields, making schema flexibility essential. Traditional databases and data warehouses struggle to handle such dynamic schemas efficiently, while datalake systems offer storage flexibility but fall short in real-time analytical performance.
-
Integration with Multiple Data Sources and Analysis Tools: There are many observability ecosystem tools for data collection and visualization. The storage and analysis engine must integrate seamlessly with these diverse tools.
Given options like Elasticsearch, ClickHouse, Doris, and logging services provided by Cloud vendors, how should one choose? Here are the key evaluation criteria:
1. Performance: Includes Write and Query Performance
Since observability is often used in urgent situations like troubleshooting, queries must respond quickly—especially for textual content in Logs and Traces, which require real-time full-text search to support iterative exploration. Additionally, users must be able to query near real-time data—queries limited to data from hours or minutes ago are insufficient; fresh data from the past few seconds is needed.
- Elasticsearch is known for inverted indexing and full-text search, offering sub-second retrieval. However, it struggles with high-throughput writes, often rejecting writes or experiencing high latency during peak loads. Its aggregation and statistical analysis performance is also relatively weak.
- Cloud Logging Services provide sufficient performance through rich resources but come with higher costs.
- ClickHouse delivers high write throughput and high aggregation query performance using columnar storage and vectorized execution. However, its full-text search performance lags behind Elasticsearch and Doris by multiples and remains experimental and unsuitable for production use.
- Doris, leveraging columnar storage and vectorized execution, optimizes inverted indexing for observability scenarios. It offers better performance than Elasticsearch, with ~5x faster writes and ~2x faster queries. Aggregation performance is up to 6–21x better than Elasticsearch.
2. Cost: Includes Storage and Compute Costs
Observability data volumes are huge, especially Logs and Traces. Medium-to-large enterprises generate TBs or even PBs of data daily. Due to business or regulatory needs, data must be retained for months or years, pushing storage requirements into the PB or even EB range. Compared to business-critical data, observability data has lower value density, and its value decreases over time, making cost sensitivity critical. Additionally, processing massive volumes of data incurs substantial compute costs.
- Elasticsearch suffers from high costs. Its storage model combines row-based raw data, inverted indexes, and docvalue columnar storage, with typical compression ratios around 1.5:1. High CPU overhead from JVM and index construction further increases compute costs.
- Doris includes numerous optimizations for observability scenarios. Compared to Elasticsearch, it reduces total cost by 50–80%. These include simplified inverted indexing, columnar storage with ZSTD compression (5:1–10:1), cold-hot tiered storage, single-replica writes, time-series compaction to reduce write amplification, and vectorized index building.
- ClickHouse uses columnar storage and vectorized engines, delivering lower storage and write costs.
- Cloud Logging Services are expensive as Elasticsearch.
3. Openness: Includes Open Source and Multi-Cloud Neutrality
When selecting an observability platform, consider openness, including whether it's open source and multi-cloud neutral.
- Elasticsearch is an open-source project maintained by Elastic, available on multiple clouds. Its ELK ecosystem is self-contained and difficult to integrate with other ecosystems, eg. Kibana only supports Elasticsearch and is hard to extend.
- Doris is an Apache Top-Level open-source project, supported by major global cloud providers. It integrates well with OpenTelemetry, Grafana, and ELK, maintaining openness and neutrality.
- ClickHouse is an open-source project maintained by ClickHouse Inc., available across clouds. While it supports OpenTelemetry and Grafana, its acquisition of an observability company raises concerns about future neutrality.
- Cloud Logging Services are tied to their respective clouds, not open source, and differ between vendors, limiting consistent experiences and migration flexibility.
4. Ease of Use: Includes Manageability and Usability
Due to the volume of data, observability platforms usually adopt distributed architectures. Ease of deployment, scaling, upgrades, and other management tasks significantly affects scalability. The interface provided by the system determines developer efficiency and user experience.
- Elasticsearch's Kibana web UI is very user-friendly and manageable. However, its DSL query language is complex and hard to learn, posing integration and development challenges.
- Doris provides an interactive analysis interface similar to Kibana and integrates natively with Grafana and Kibana (comming soon). Its SQL is standard and MySQL-compatible, making it developer- and analyst-friendly. Doris has a simple architecture that’s easy to deploy and maintain, supports online scaling without service interruption, automatic load balancing, and includes a visual Cluster Manager.
- ClickHouse provides SQL interfaces but uses its own syntax. Maintenance is challenging due to exposed concepts like local tables vs. distributed tables and lack of automatic rebalancing during scaling. Typically, developing a custom cluster management system is required.
- Cloud Logging Services offer SaaS convenience—users don't manage infrastructure and enjoy ease of use.
Based on the above analysis, Doris achieves high-performance ingestion and queries while keeping costs low. Its SQL interface is easy to use, and its architecture is simple to maintain and scale. It also ensures consistent experiences across multiple clouds, making it an optimal choice for building an observability platform.
Observability Solution Based on Doris
System Architecture
Apache Doris is a modern data warehouse with an MPP distributed architecture, integrating vectorized execution engines, CBO optimizers, advanced indexing, and materialized views. It supports ultra-fast querying and analysis on large-scale real-time datasets, delivering an exceptional analytical experience. Through continuous technical innovation, Doris has achieved top rankings in authoritative benchmarks such as ClickBench (single table), TPC-H, and TPC-DS (multi tables).
For observability scenarios, Doris introduces inverted indexing and ultra-fast full-text search capabilities, achieving optimized write performance and storage efficiency. This allows users to build high-performance, low-cost, and open observability platforms based on Doris.
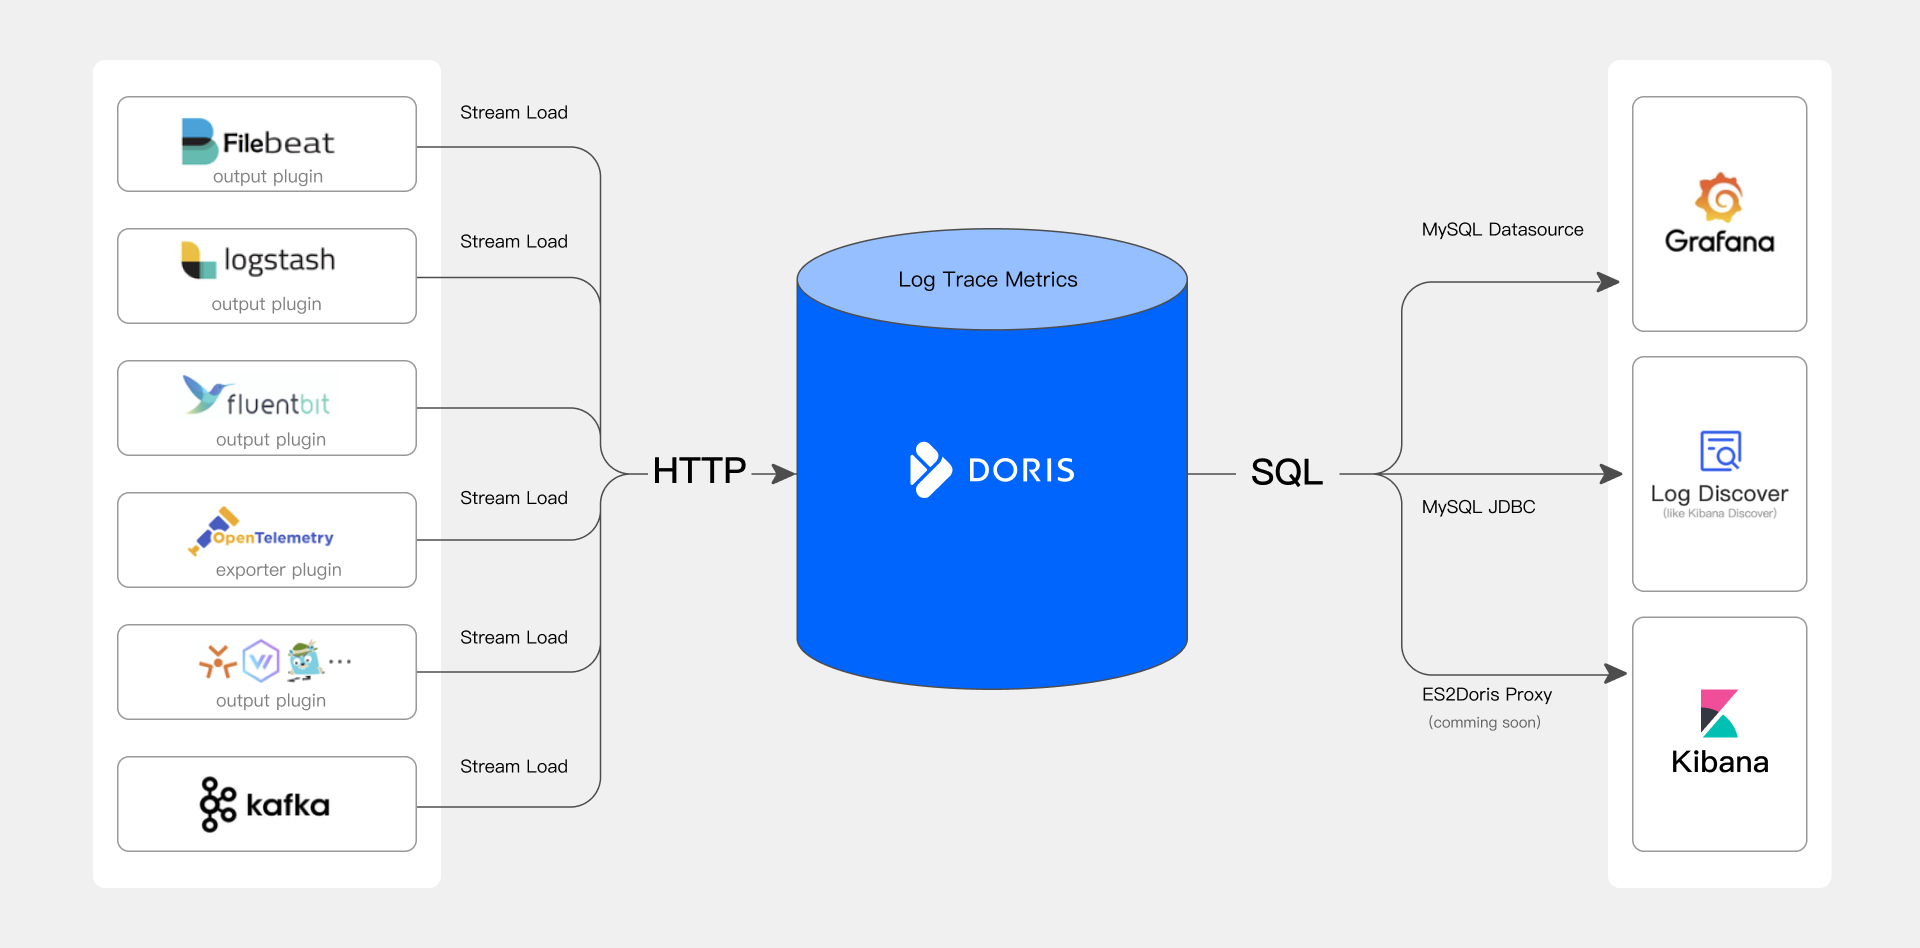
A Doris-based observability platform consists of three core components:
- Data Collection and Preprocessing: Supports various observability data collection tools, including OpenTelemetry and ELK ecosystem tools like Logstash and Filebeat. Log, Trace, and Metric data are ingested into Doris via HTTP APIs.
- Data Storage and Analysis Engine: Doris provides unified, high-performance, low-cost storage for observability data and exposes powerful search and analysis capabilities via SQL interfaces.
- Query Analysis and Visualization: Integrates with popular observability visualization tools such as Grafana and Kibana (from the ELK stack), offering intuitive interfaces for searching, analyzing, alerting, and achieving real-time monitoring and rapid response.
Key Features and Advantages
High Performance
- High Throughput, Low Latency Writes: Supports stable ingestion of PB-scale (10GB/s) Log, Trace, and Metric data daily with sub-second latency.
- High-Performance Inverted Index and Full-Text Search: Supports inverted indexing and full-text search, delivering sub-second response times for common log keyword searches—3–10x faster than ClickHouse.
- High-Performance Aggregation Analysis: Utilizing MPP distributed architecture and vectorized pipeline execution engines, Doris excels in trend analysis and alerting in observability scenarios, leading globally in ClickBench tests.
Low Cost
- High Compression Ratio and Low-Cost Storage: Supports PB-scale storage with compression ratios of 5:1 – 10:1 (including indexes), reducing storage costs by 50–80% compared to Elasticsearch. Cold data can be offloaded to S3/HDFS, cutting storage costs by another 50%.
- Low-Cost Writes: Consumes 70% less CPU than Elasticsearch for the same write throughput.
Flexible Schema
- Schema Changes at the Top Level: Users can use Light Schema Change to add or drop columns or indexes (ADD/DROP COLUMN/INDEX), and schema modifications can be completed in seconds. When designing an observability platform, users only need to consider which fields and indexes are needed at the current stage.
- Internal Field Changes: A semi-structured data type called VARIANT is specially designed for scalable JSON data. It can automatically identify field names and types within JSON, and further split frequently occurring fields into columnar storage, improving compression ratio and analytical performance. Compared to Elasticsearch’s Dynamic Mapping, VARIANT allows changes in the data type of a single field.
User-Friendly
- Standard SQL Interface: Doris supports standard SQL and is compatible with MySQL protocols and syntax, making it accessible to engineers and analysts.
- Integration with Observability Ecosystems: Compatible with OpenTelemetry and ELK ecosystems, supporting Grafana and Kibana (comming soon) visualization tools for seamless data collection and analysis.
- Easy Operations: Supports online scaling, automatic load balancing, and visual management via Cluster Manager.
Openness
- Open Source: Apache Doris is a top-level open-source project adopted by over 5000 companies worldwide, supporting OpenTelemetry, Grafana, and other observability ecosystems.
- Multi-Cloud Neutral: Major cloud providers offer Doris SaaS services, ensuring consistent experiences across clouds.
Demo & Screenshots
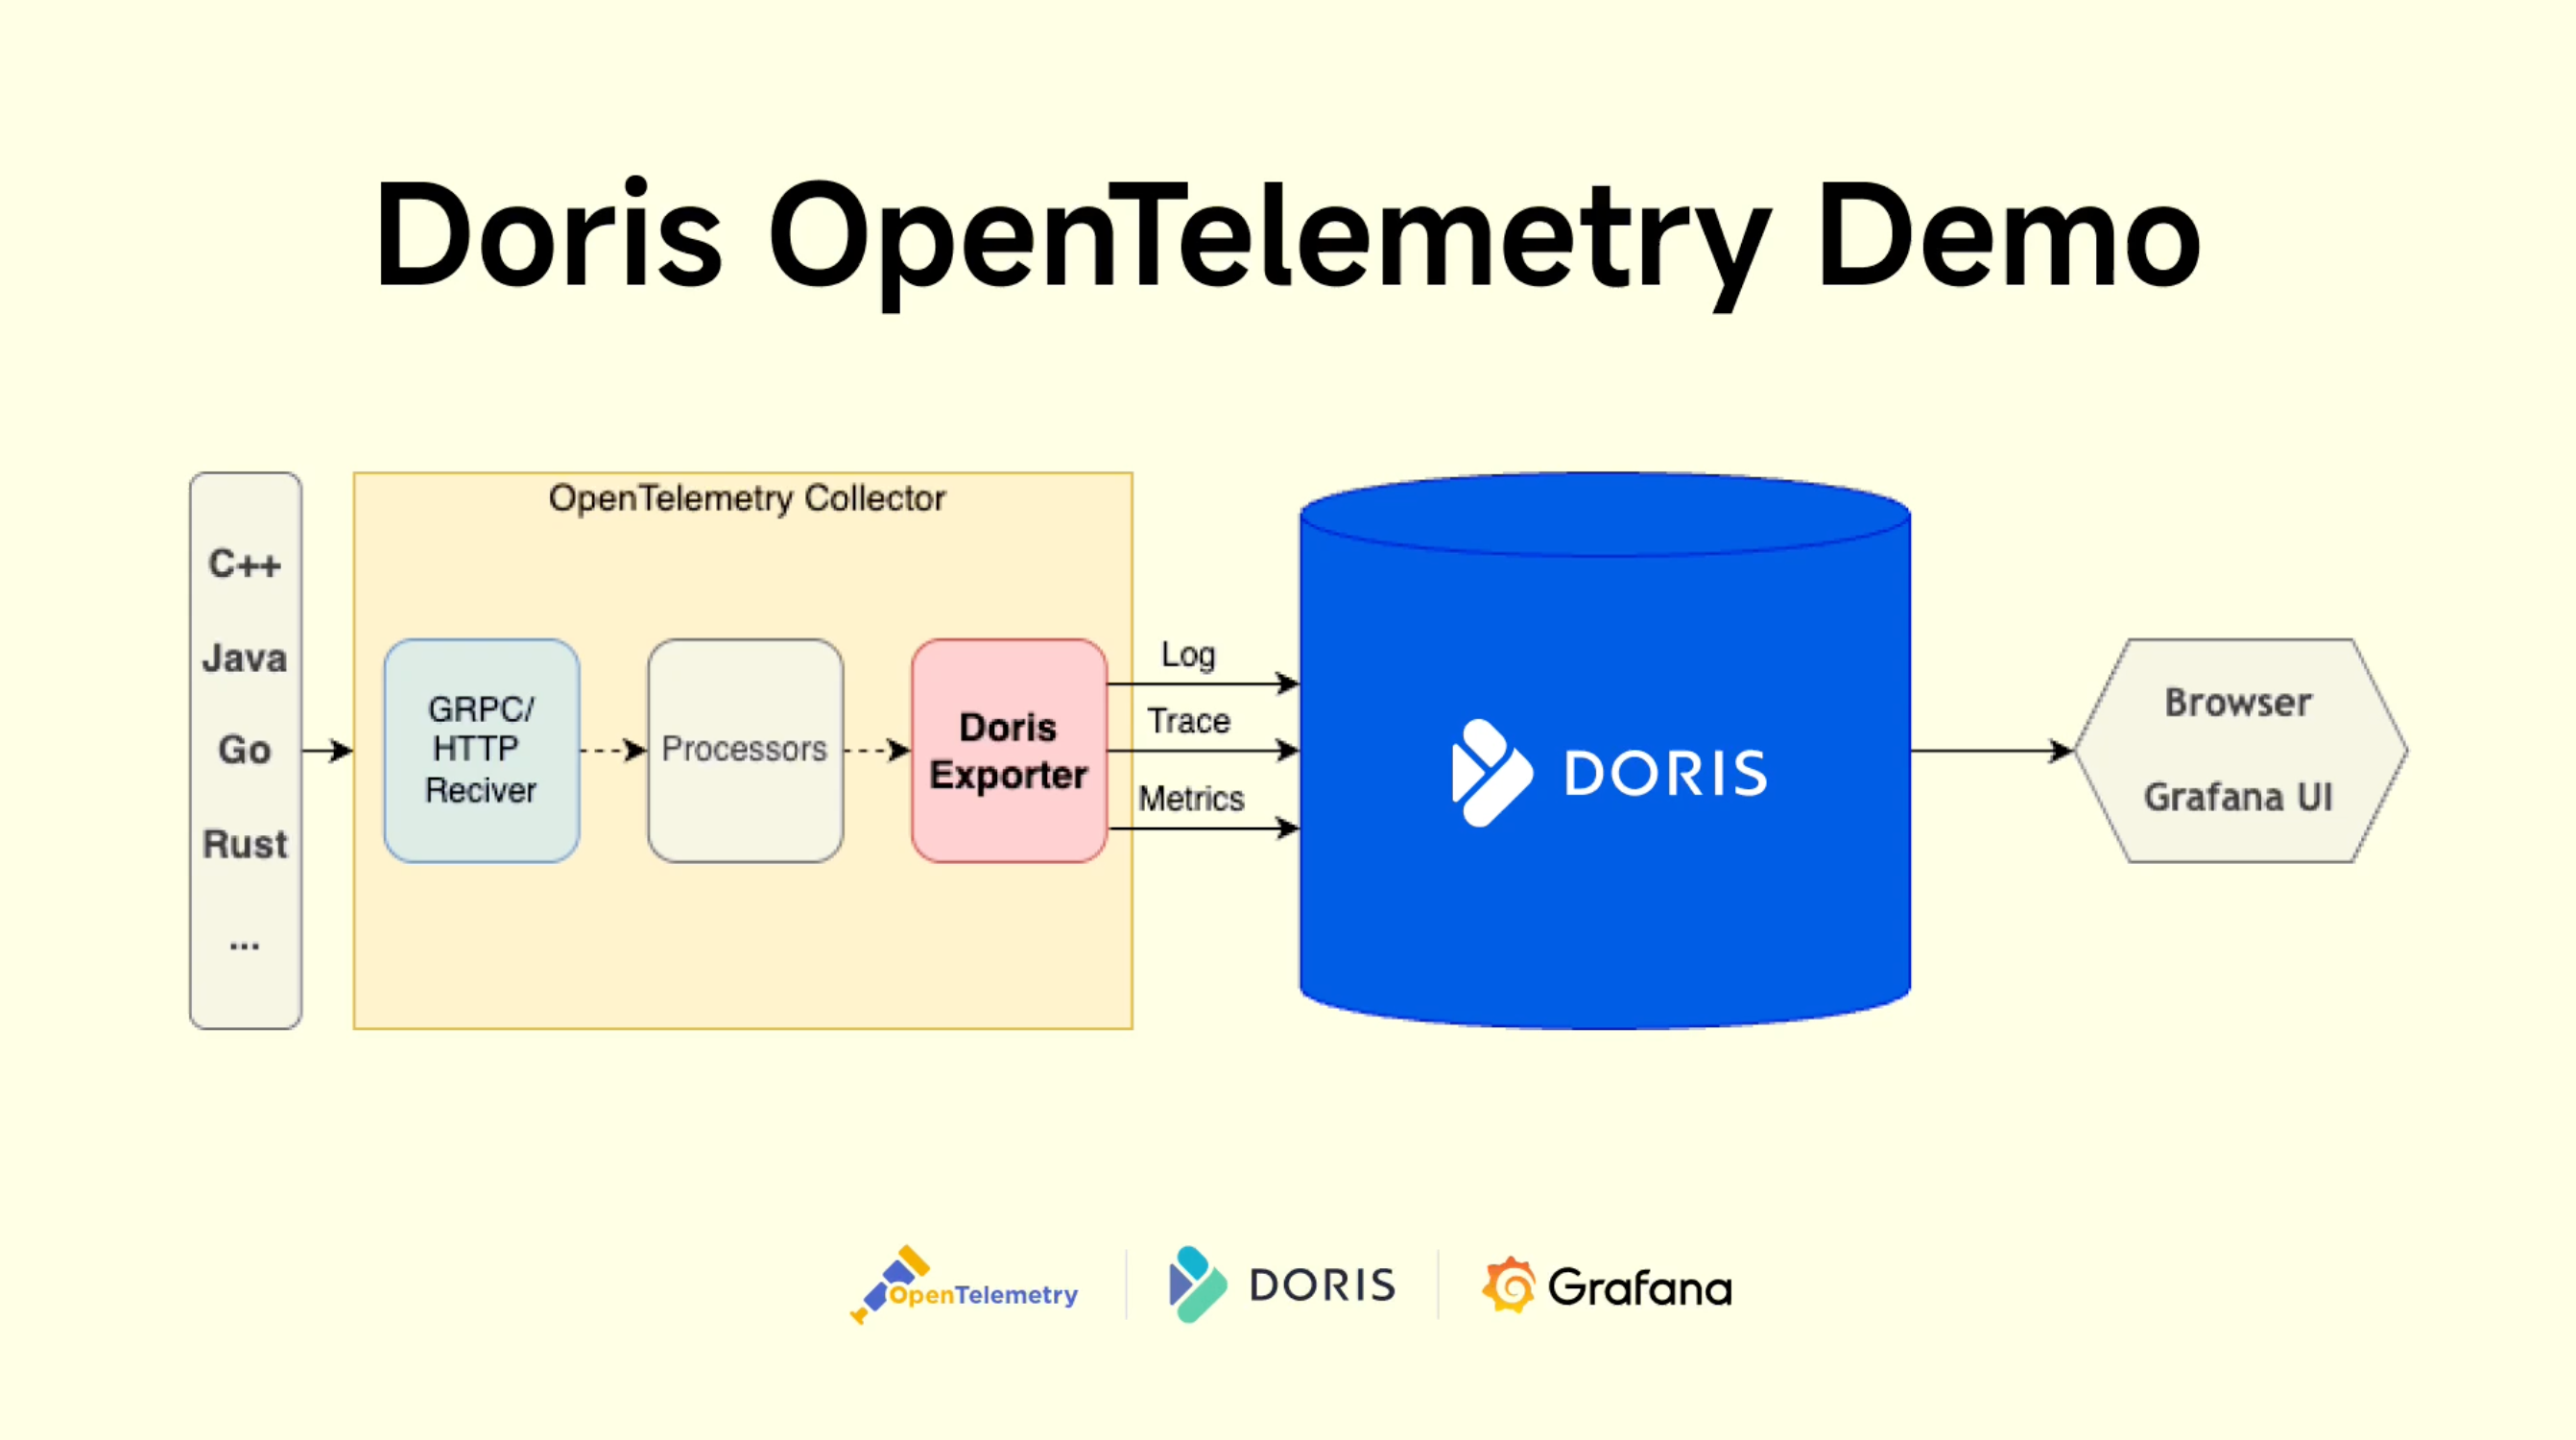
We demonstrate the Doris-based observability platform using a comprehensive demo from the OpenTelemetry community.
The observed business system simulates an [e-commerce website] (https://opentelemetry.io/docs/demo/architecture/) composed of frontend, authentication, cart, payment, logistics, advertising, recommendation, risk control, and more than ten modules, reflecting a high level of system complexity, thus presenting significant challenges for observability data collection, storage, and analysis.
The Load Generator tool sends continuous requests to the entry service, generating vast volumes of observability data (Logs, Traces, Metrics). These data are collected using OpenTelemetry SDKs in various languages, sent to the OpenTelemetry Collector, preprocessed by Processors, and finally written into Doris via the OpenTelemetry Doris Exporter. Observability visualization tools such as Grafana connects to Doris through the MySQL interface, providing visualized query and analysis capabilities.
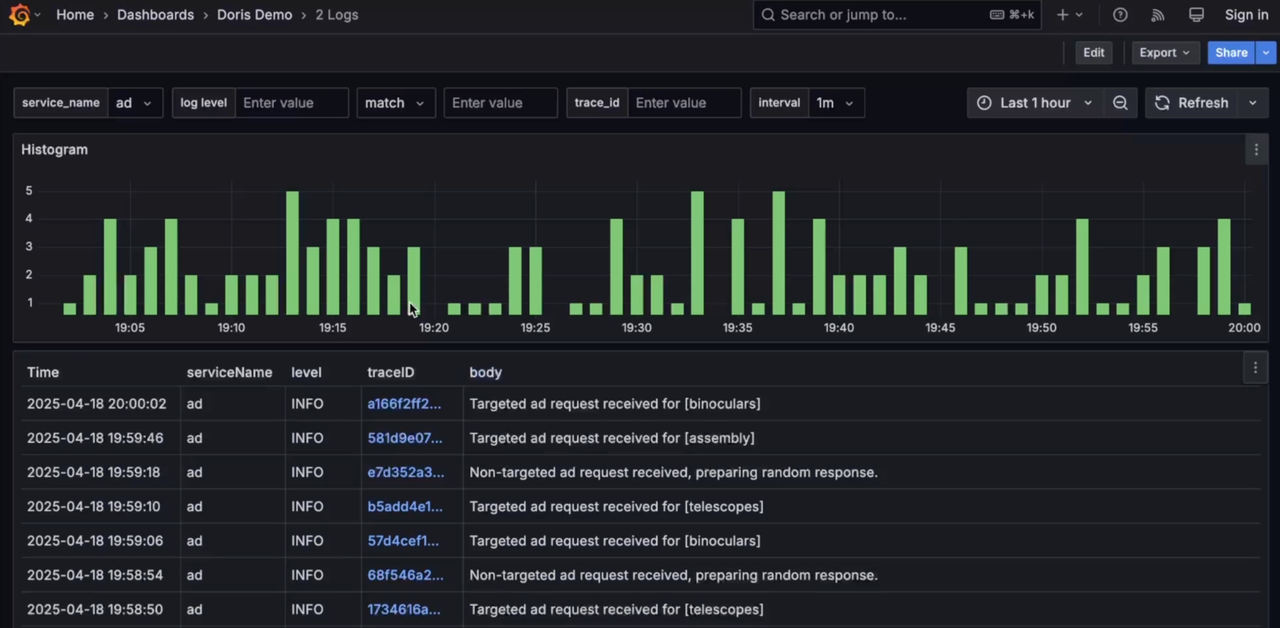
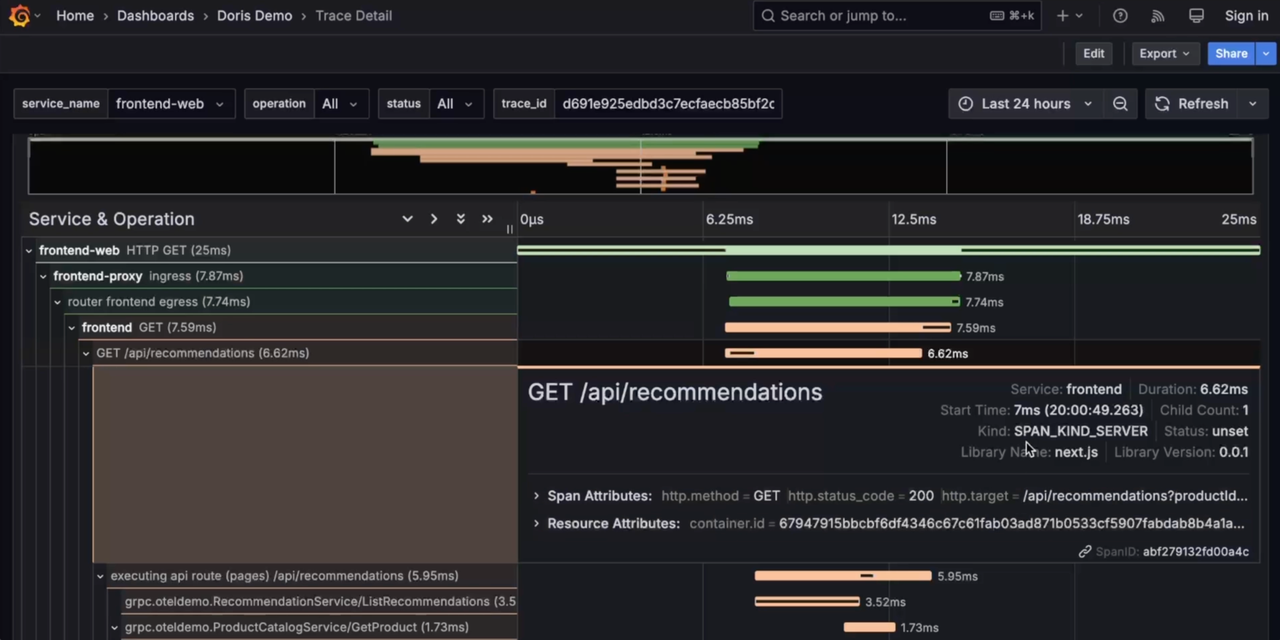
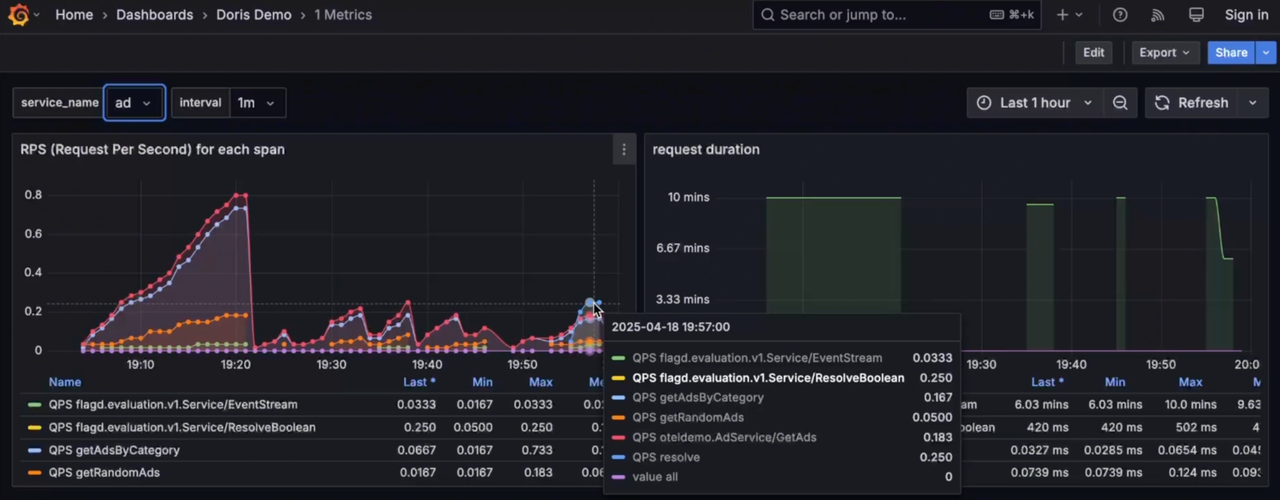
Grafana connects to Doris via MySQL datasource, offering unified visualization and analysis of Logs, Traces, and Metrics, including cross-analysis between Logs and Traces.
-
Log
-
Trace
-
Metrics
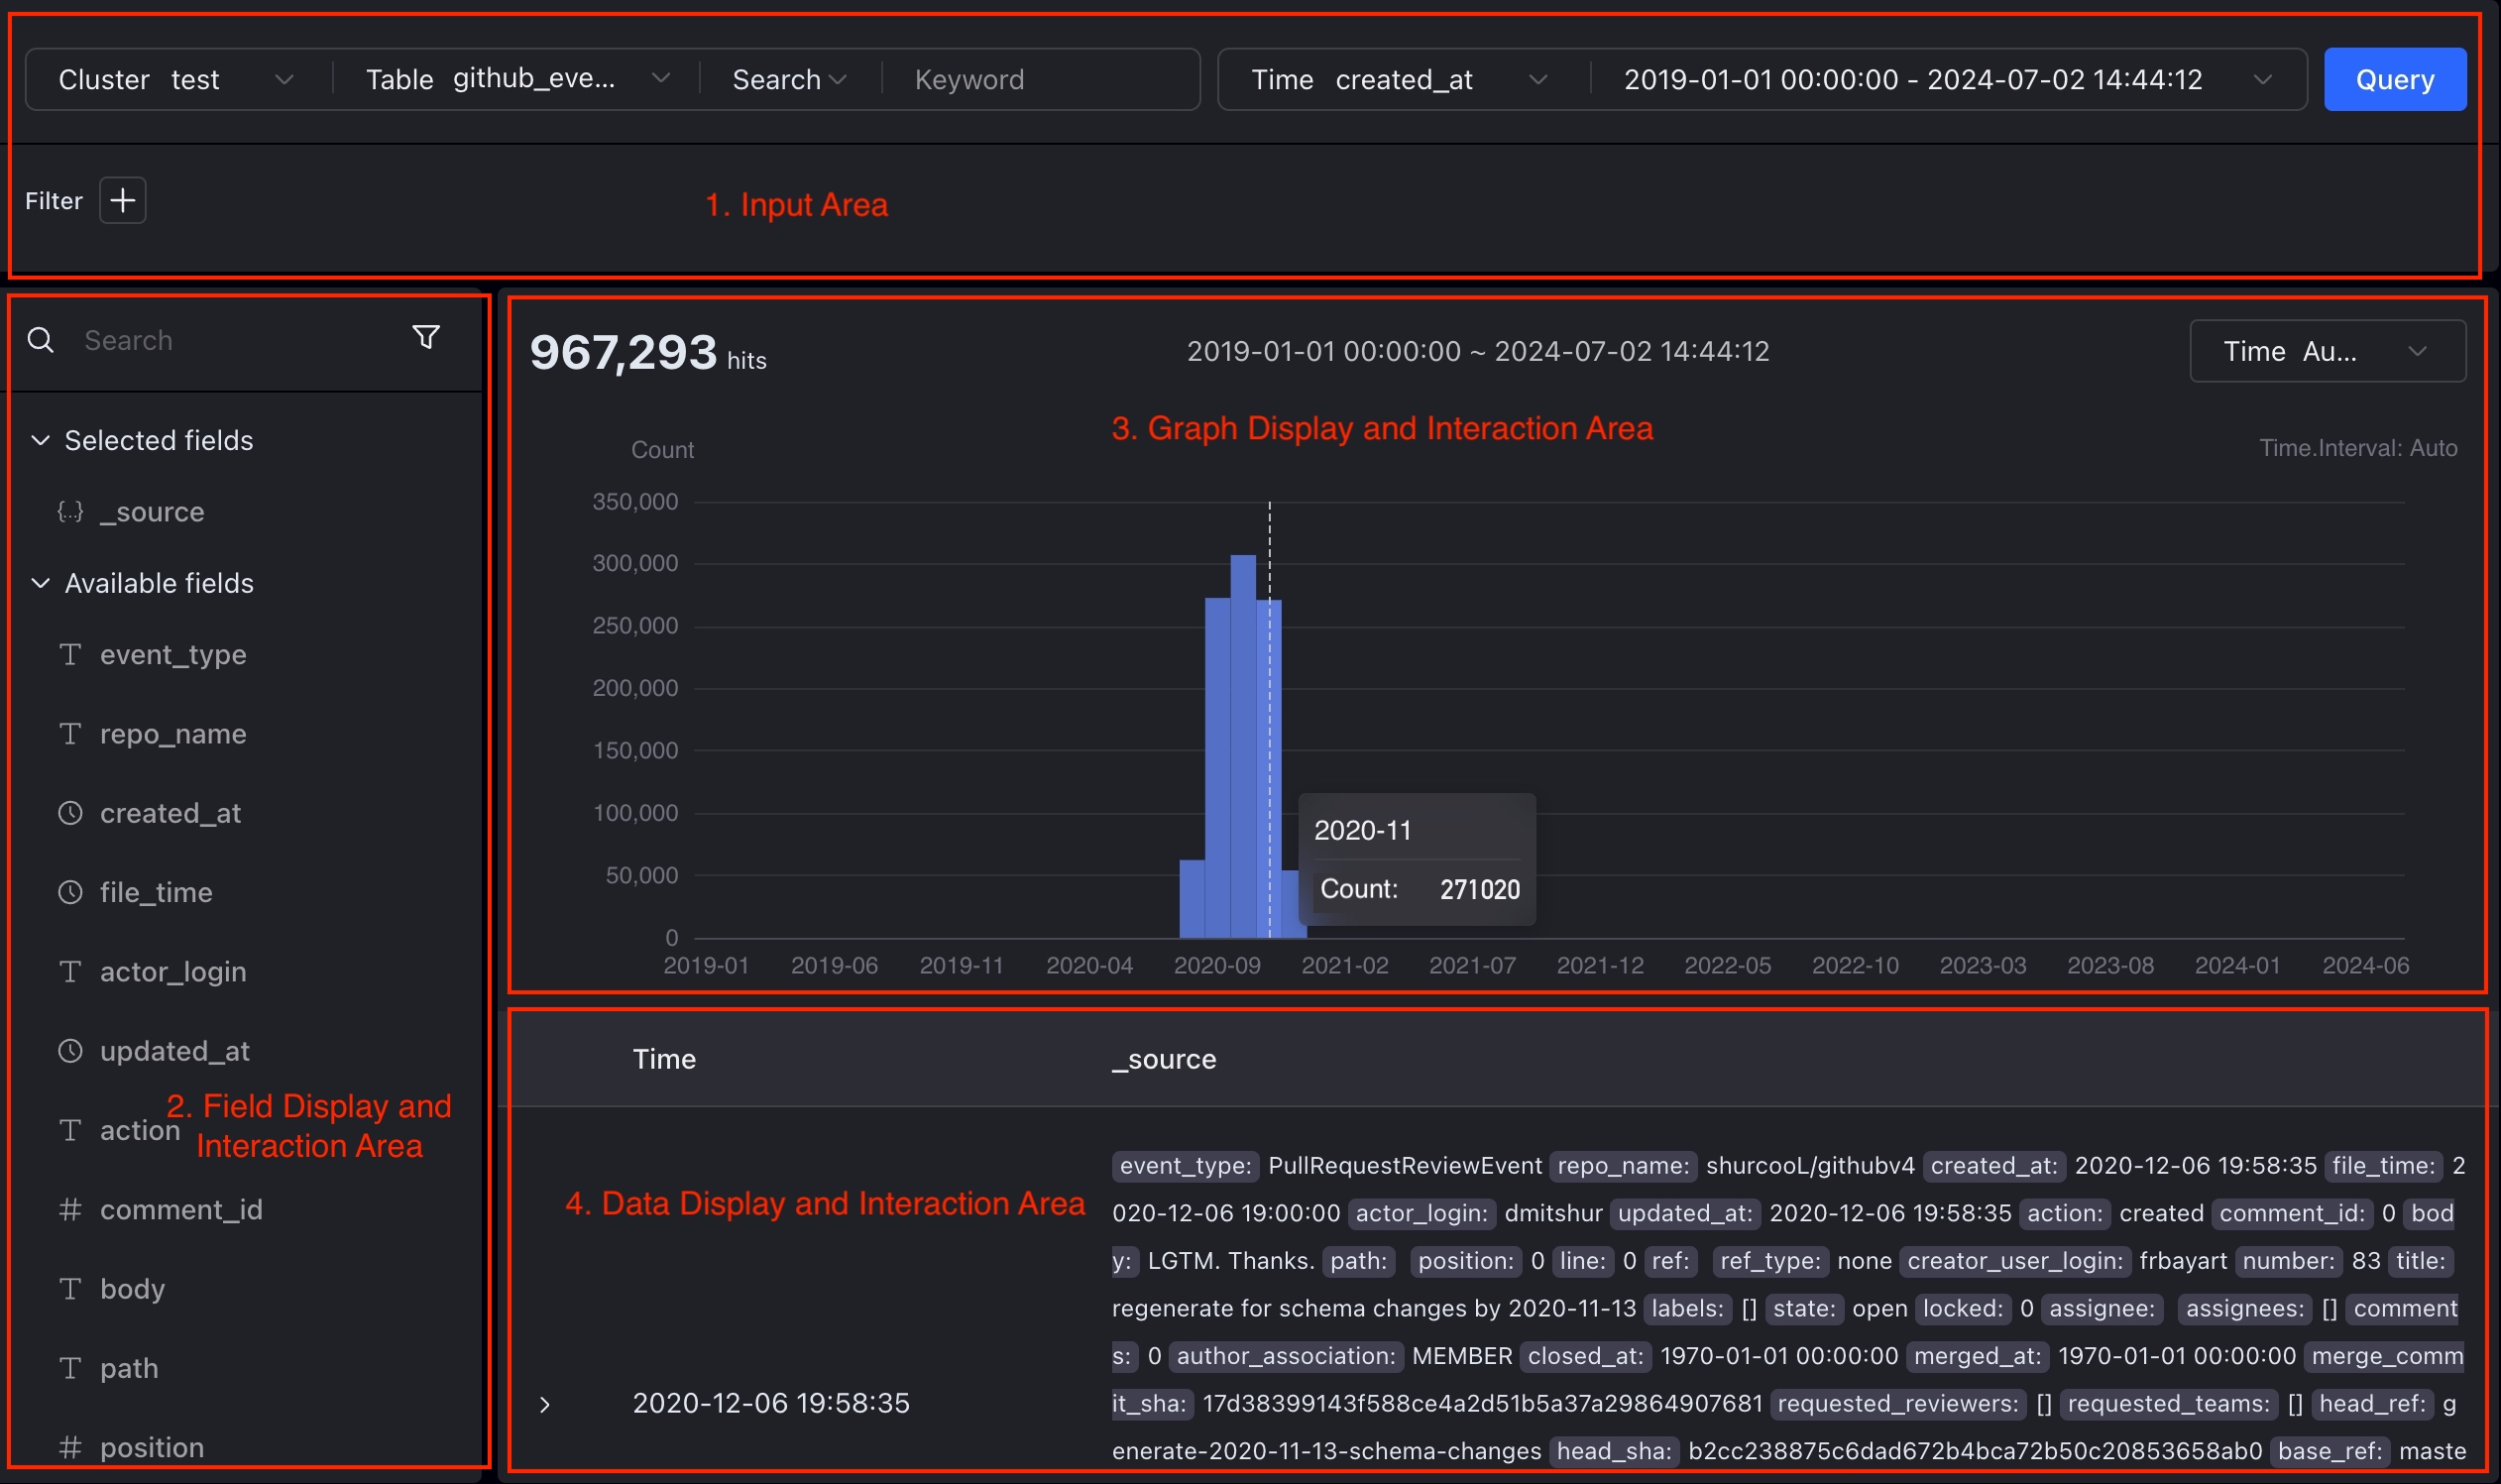
While Grafana's log visualization and analysis capabilities are relatively basic compared to Kibana, third-party vendors have implemented Kibana-like Discover features. These will soon be integrated into Grafana's Doris datasource, enhancing unified observability visualization. Future enhancements will include Elasticsearch protocol compatibility, enabling native Kibana connections to Doris. For ELK users, replacing Elasticsearch with Doris maintains existing logging and visualization habits while significantly reducing costs and improving efficiency.