Building Unified Log/Trace/Metrics Analytics on Apache Doris
Observability is the ability to infer the internal state of a system from its external output data. An observability platform collects, stores, and visualizes three types of key data: Logging, Tracing, and Metrics. It helps teams gain a comprehensive understanding of how distributed systems are running, supports resource optimization, fault alerting, and root cause analysis, and ultimately improves system reliability and user experience.
Why Observability Is Becoming More Important
Core Application Scenarios
Observability platforms have become indispensable infrastructure for modern distributed systems, mainly covering the following five categories of scenarios:
| Scenario | Value | Typical Use Cases |
|---|---|---|
| Troubleshooting and root cause analysis | Shortens fault recovery time and ensures business continuity | Real-time monitoring, anomaly detection, distributed tracing, chaos engineering |
| Performance optimization and resource planning | Identifies performance bottlenecks and reduces cloud resource costs | Resource utilization analysis, load balancing, auto-scaling, capacity prediction |
| Business decision support | Connects IT performance to business outcomes | User experience metric analysis, product feature optimization |
| Security and compliance monitoring | Detects abnormal behavior and responds automatically | Zero-day attack detection, log auditing, compliance retention |
| Development and operations collaboration | Assists canary release and code optimization | Traffic tagging, call chain analysis, release progress evaluation |
Two Major Trends Driving the Upgrade of Observability
- Business and IT systems are growing more complex: With the development of cloud computing and microservices, a request from a GenAI application may involve dozens of services such as the App, service gateway, authentication service, billing service, RAG engine, Agent engine, vector database, business database, distributed cache, message queue, and large model APIs. Logging into servers to inspect runtime status and analyze faults is no longer effective in such complex systems. An observability platform unifies the collection and storage of Log, Trace, and Metrics data and provides unified visualization analysis, which can effectively and quickly surface issues.
- Business reliability requirements are getting higher: System failures have an increasingly costly impact on user experience, and the requirements for fault localization and recovery efficiency have risen accordingly. Through cross-domain data integration and panoramic visualization, observability supports teams in quickly locating the root cause of issues and reducing business interruption time. Through global data analysis and prediction, it can identify resource bottlenecks in advance, allowing teams to handle them early and prevent failures.
How to Choose an Observability Solution
Key Characteristics of Observability Data
How to address the storage and analysis challenges of massive data volumes is at the core of any observability solution. Observability data has the following five characteristics:
- Large data storage volume and cost-sensitive: Log and Trace data are typically very large in scale and are produced continuously around the clock. The observability data generated by mid-size and large enterprises every day is on the TB or even PB level. To meet business requirements or comply with regulatory requirements, this data often needs to be stored for half a year or longer, with total storage frequently reaching the PB level and incurring high costs. As time passes, the value of this data also gradually declines, so observability platforms are particularly sensitive to storage costs.
- High write throughput with real-time requirements: Faced with new data on the order of TB or even PB per day, the platform must support write throughput of 1-10 GB/s and millions to tens of millions of records per second. At the same time, considering scenarios such as troubleshooting and security tracking that require strong timeliness, write latency must remain at the second level to ensure data freshness and availability.
- Real-time analysis with full-text search: Log and Trace data contain large amounts of text, and quickly searching for keywords and phrases is a core requirement. Because of the massive data scale, traditional full-scan and string-matching approaches cannot meet real-time response requirements. Building inverted indexes for text becomes the key to achieving second-level query response.
- Dynamic schemas requiring frequent extension: Log data has evolved from unstructured raw logs (free text) to semi-structured Logs and Traces predominantly in JSON. Data producers dynamically adjust internal JSON fields, and the schema is highly flexible. Traditional databases and data warehouses struggle to efficiently handle data with such flexible schemas. Data lakes provide storage flexibility but cannot meet processing performance and real-time requirements.
- Need to integrate with diverse data sources and analysis tools: The observability ecosystem includes many data collectors and visualization analysis tools. The storage and analysis engine needs to integrate with various ecosystem tools to satisfy diverse data and tool integration requirements.
Four Key Dimensions for Selection Evaluation
Faced with multiple solutions such as Elasticsearch, ClickHouse, Doris, and cloud vendor log services, you can evaluate them along four dimensions: performance, cost, openness, and ease of use.
1. Performance: Write Performance and Query Performance
Observability is often used in urgent scenarios such as troubleshooting, with high requirements for both query response speed and data freshness. On the one hand, query response must be fast, especially for the text in Log/Trace data, which requires real-time full-text search to support iterative exploratory analysis. On the other hand, the most recently produced data must be queryable, with second-level freshness as a requirement.
| Solution | Write Performance | Full-Text Search | Aggregation Analysis |
|---|---|---|---|
| Elasticsearch | Write performance is relatively low under high throughput, with write rejections and high latency easily occurring during peak periods | Known for inverted index + full-text search, with second-level real-time search | Aggregation analysis performance is relatively low |
| Cloud vendor log service | Meets performance via stacking resources | Meets performance requirements | Meets performance requirements |
| ClickHouse | Columnar storage + vectorized engine, with high write performance | Several to tens of times slower than Elasticsearch and Doris, still in experimental status | High aggregation query performance |
| Doris | Columnar storage + vectorized engine, with inverted indexes optimized for observability, about 5x faster than Elasticsearch | About 2x faster than Elasticsearch | 6-21x faster than Elasticsearch |
2. Cost: Storage Cost and Compute Cost
The observability data generated by mid-size and large enterprises every day can reach the TB or even PB level, with total storage often reaching the PB or even EB level. Compared with business data, observability data has a larger volume, lower value density, and value that gradually declines over time, so it is highly sensitive to both storage and compute costs.
| Solution | Compression Ratio | Storage / Compute Cost |
|---|---|---|
| Elasticsearch | About 1.5:1 (row storage + inverted index + docvalue columnar storage) | High storage cost; JVM overhead + inverted index construction lead to high CPU usage |
| Doris | 5:1 ~ 10:1, with hot-cold tiering further reducing costs | Saves 50%-80% compared with Elasticsearch; single-replica writes, time-series compaction, and vectorized index construction lower write cost |
| ClickHouse | Columnar storage with good compression | Low storage and write cost |
| Cloud vendor log service | - | Equally high as Elasticsearch |
3. Openness: Open Source and Multi-Cloud Neutrality
Building an observability platform requires avoiding vendor lock-in. Pay attention to whether the solution is open source, whether it is offered across multiple clouds, and whether it supports an open ecosystem.
| Solution | Project Operator | Multi-Cloud Support | Ecosystem Openness |
|---|---|---|---|
| Elasticsearch | Elastic | Offered across multiple clouds | The ELK ecosystem is relatively isolated, and Kibana only supports Elasticsearch |
| Doris | Apache Software Foundation | Mainstream cloud vendors offer SaaS | Supports OpenTelemetry, Grafana, ELK, and other open source ecosystems, remains neutral |
| ClickHouse | ClickHouse Inc. | Offered across multiple clouds | Supports OpenTelemetry and Grafana; neutrality is affected after acquiring an observability commercial company |
| Cloud vendor log service | Each cloud vendor | Bound to its own cloud | Not open source, with difficult cross-cloud migration |
4. Ease of Use: Maintainability and Convenience
Because of the large data volume, observability platforms generally adopt a distributed architecture. The convenience of operations such as deployment, scaling, and upgrades, along with the developer-friendliness of the query interface, are all important considerations.
| Solution | Interface and Operations |
|---|---|
| Elasticsearch | Kibana provides an easy-to-use interface and good maintainability; the DSL query language is complex with a high usage barrier |
| Doris | Provides a Kibana-like interactive search and analysis interface, and integrates with native Kibana / Grafana interfaces; standard SQL compatible with MySQL; simple architecture, supports online upgrades and scaling, automatic load balancing, and provides a visual Cluster Manager |
| ClickHouse | Custom dialect SQL; underlying concepts of local tables + distributed tables are exposed, scaling cannot be balanced automatically, and a self-built operations system is usually required |
| Cloud vendor log service | SaaS service requires no self-maintenance and is convenient to use |
Selection Conclusion
Based on the comparison above, Doris has clear advantages across all four dimensions of performance, cost, openness, and ease of use: it delivers high-performance writes and queries while keeping costs low, the SQL interface is simple and easy to use, the simple architecture is easy to maintain and extend, and it provides a consistent experience across multiple clouds. It is an ideal choice for building an observability platform.
Doris-Based Observability Solution
System Architecture
Doris is a modern data warehouse that adopts an MPP distributed architecture and combines advanced technologies such as a vectorized execution engine, a CBO optimizer, rich indexes, and materialized views to support extremely fast query analysis on large-scale real-time data. Doris has achieved globally leading and even first-place results in multiple authoritative analytical database performance benchmarks, including the single-table ClickBench, multi-table TPC-H, and TPC-DS.
For the characteristics of observability scenarios, Doris adds inverted indexes and extremely fast full-text search capabilities, achieves the ultimate optimization of write performance and storage space, and enables users to build a high-performance, low-cost, and open observability platform on Doris.
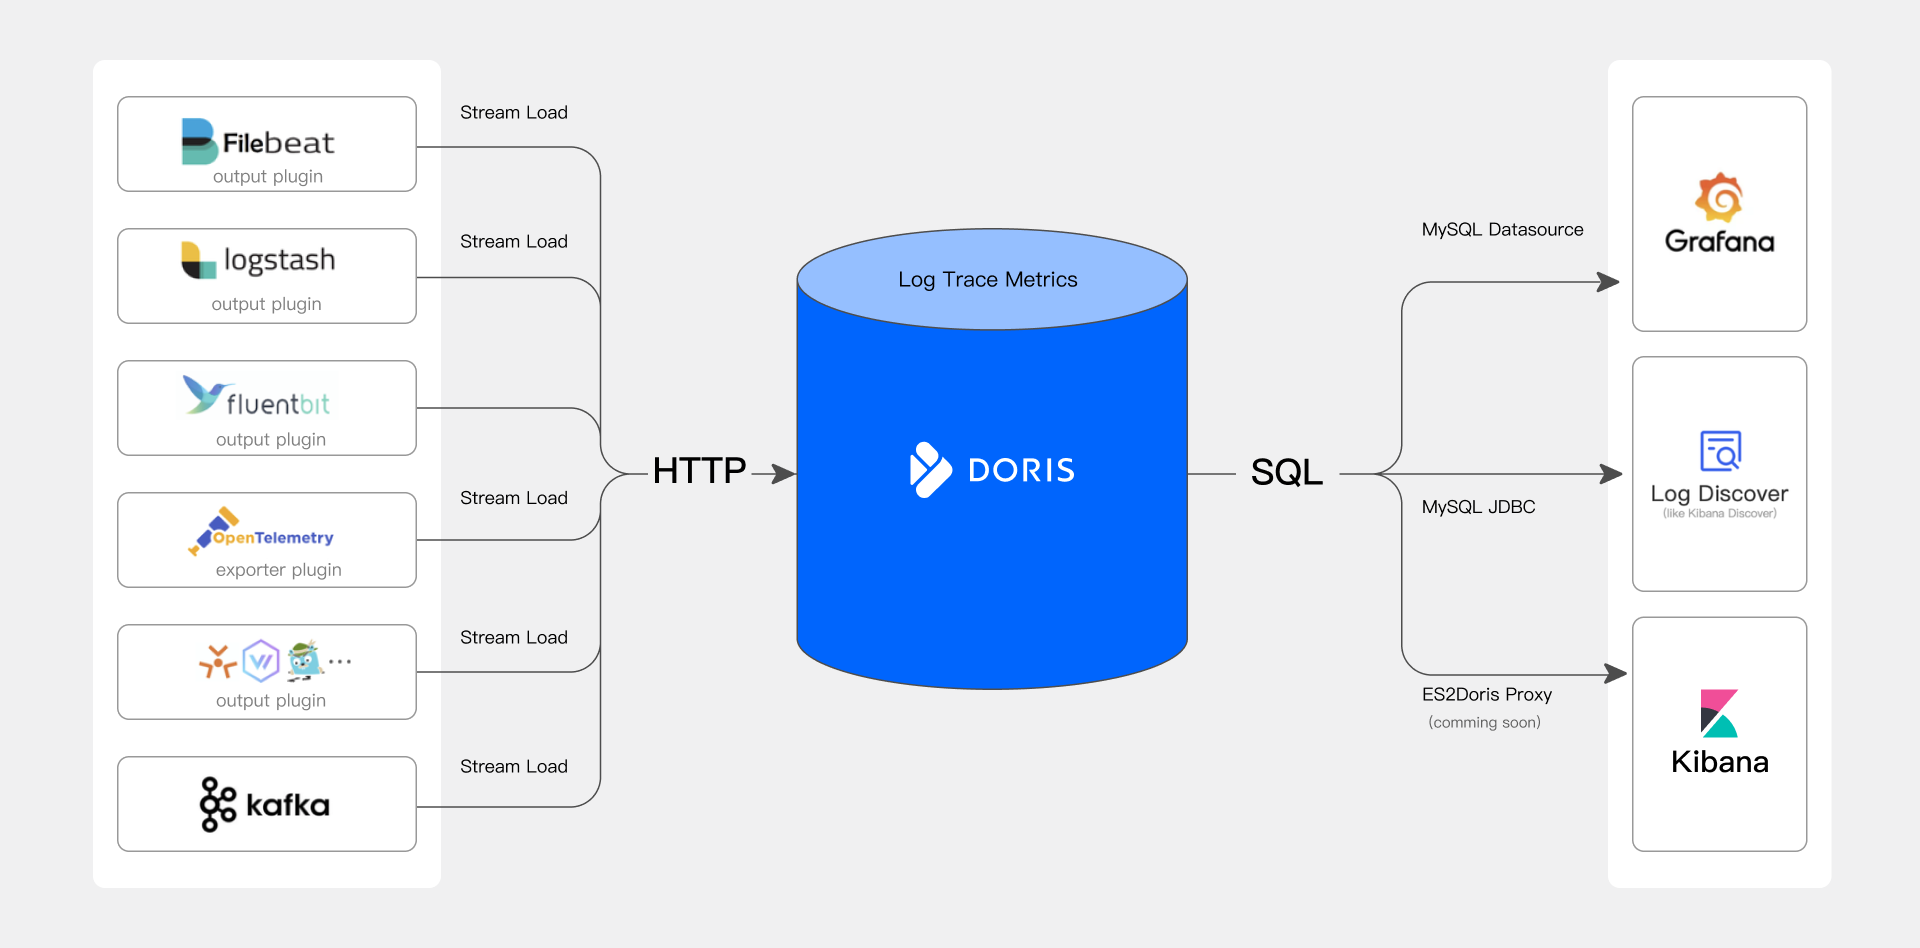
A Doris-based observability platform consists of three core components:
- Data collection and preprocessing: Supports a variety of observability data collection tools, including the open OpenTelemetry ecosystem and Logstash and Filebeat from the ELK ecosystem, which write Log, Trace, and Metrics data to Doris through HTTP APIs.
- Data storage and analysis engine: Doris provides high-performance, low-cost unified storage for observability data and offers rich search and analysis capabilities through a SQL interface.
- Query analysis and visualization: Integrates with the most commonly used visualization analysis tools, including the widely used Grafana and Kibana from the ELK ecosystem, providing users with simple and easy-to-use search, analysis, and alerting interfaces for real-time monitoring and rapid response.
Core Advantages of the Solution
High Performance
- High-throughput, low-latency writes: Supports continuous and stable writes of Log, Trace, and Metrics data at the PB level (10 GB/s) per day, with latency kept at the second level or even within 1s.
- High-performance inverted indexes and full-text search: Common queries such as log keyword search respond at the second level, 3-10x faster than ClickHouse.
- High-performance aggregation analysis: An MPP distributed architecture + vectorized Pipeline execution engine fully utilizes cluster distribution and CPU multithreading resources. ClickBench test performance is globally leading, suitable for common queries such as trend analysis and monitoring alerts.
Low Cost
- High compression ratio and low-cost storage: Supports PB-level massive storage with a compression ratio of 5:1 ~ 10:1 (including indexes), saving 50%-80% in storage cost compared with Elasticsearch. Supports storing cold data on S3/HDFS, further reducing storage cost by 50%.
- Low-cost writes: For the same write traffic, CPU resource consumption is reduced by more than 70% compared with Elasticsearch.
Flexible Schema
- Top-level field changes: Initiate ADD/DROP COLUMN/INDEX operations through Light Schema Change to complete schema changes in seconds. During the planning stage, you only need to consider which fields currently need indexes.
- Internal field changes: VARIANT, a semi-structured data type designed for extensible JSON data, can automatically recognize JSON field names and types and split frequently occurring fields into columnar storage to improve compression ratio and analysis performance. Compared with Elasticsearch's Dynamic Mapping, VARIANT allows field types to change.
Easy to Use
- Standard SQL interface: Compatible with the MySQL protocol and syntax, allowing engineers and data analysts to use SQL queries directly.
- Embracing the observability ecosystem: Covers the OpenTelemetry and ELK ecosystems and integrates with visualization tools such as Grafana and Kibana, facilitating data collection and visualization analysis.
- Convenient operations: Supports online scaling without service interruption and automatic balancing. On-premises deployment provides a visual Cluster Manager and K8s Operator tool, while the cloud offers an out-of-the-box fully managed service.
Open
- Open source: Doris is a top-level open source project of the Apache Software Foundation, adopted by more than 5,000 enterprises worldwide, and supports observability ecosystems such as OpenTelemetry and Grafana.
- Multi-cloud neutral: Mainstream cloud vendors offer Doris SaaS, providing a consistent experience across multiple clouds.
Demo and Screenshots
The following uses a comprehensive Demo from the OpenTelemetry community to showcase a Doris-based observability platform.
The Observed System
The observed business system is an e-commerce website used for demonstration. It consists of more than ten modules, including frontend interfaces, authentication, shopping cart, transactions, logistics, advertising, recommendations, and risk control. The overall system has high complexity, which poses significant challenges to the collection, storage, and analysis of observability data.
Data Flow
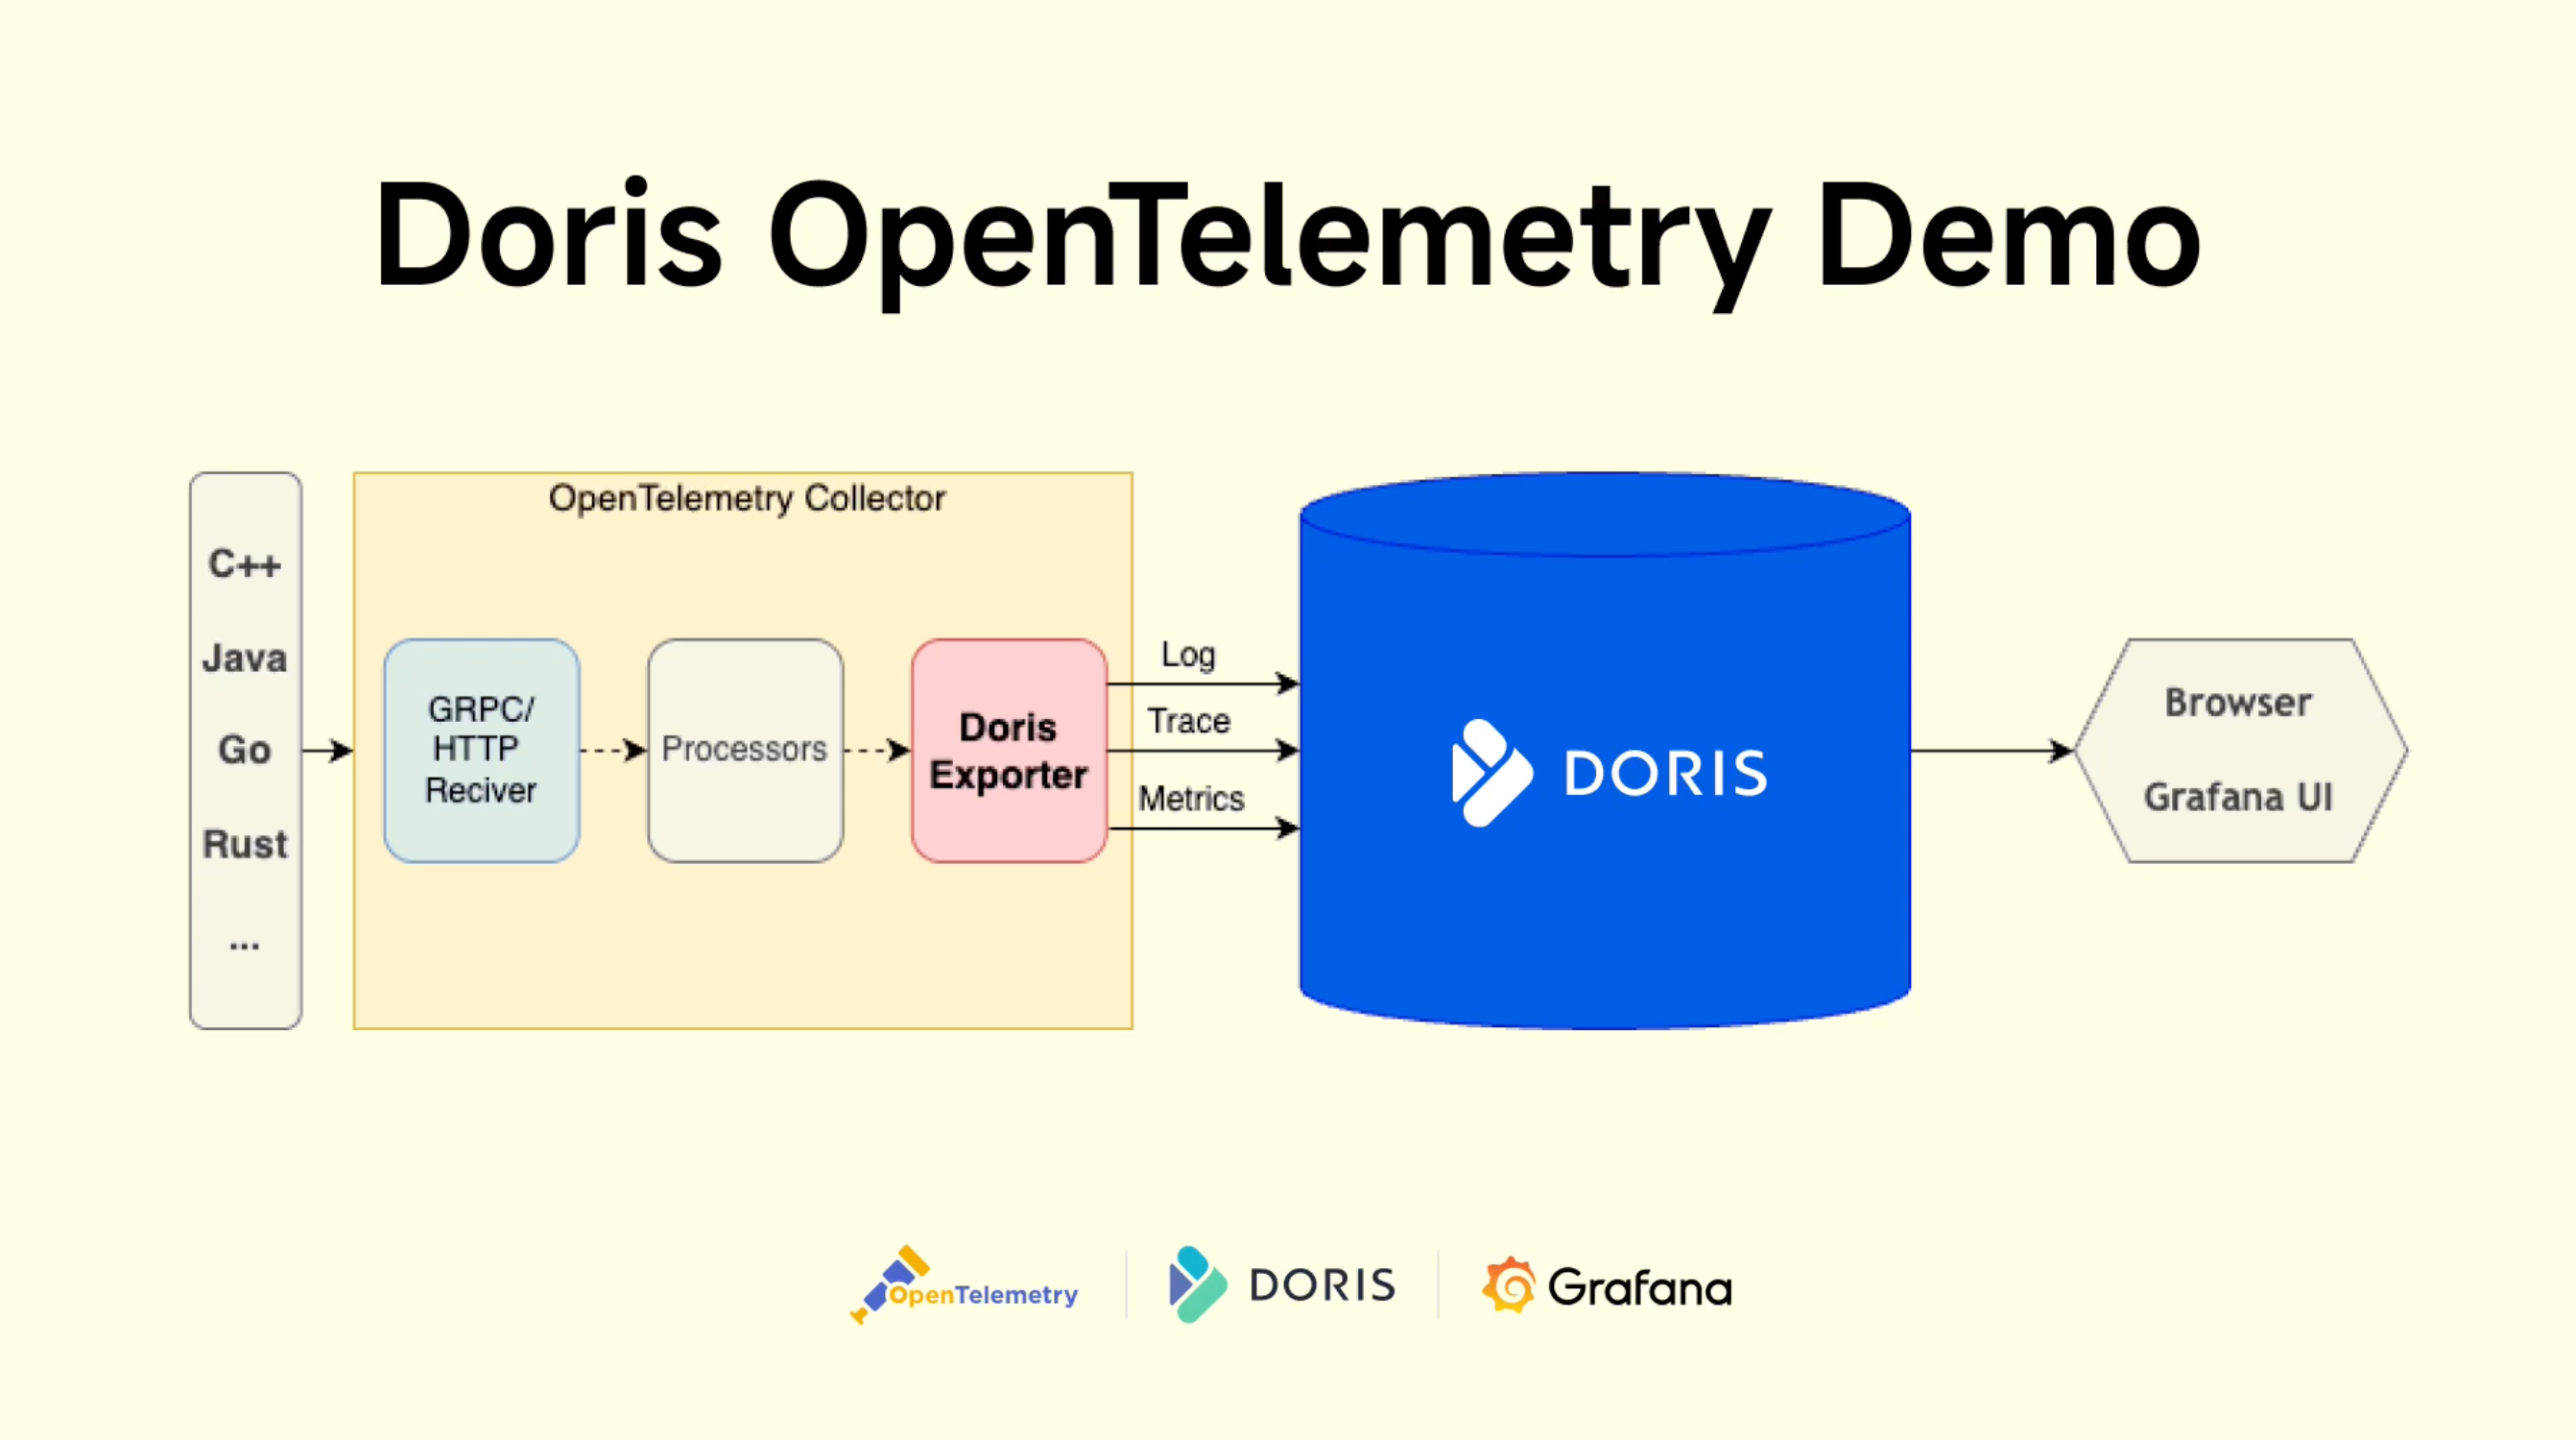
The Load Generator stress simulation program continuously sends requests to the entry service, generating a large amount of observability data (Log, Trace, Metrics) across the entire e-commerce system. The data flows as follows:
- Collected using OpenTelemetry multi-language SDKs
- Sent to the OpenTelemetry Collector
- Preprocessed by Processors in the Collector
- Written to Doris through the OpenTelemetry Doris Exporter
- Doris connects to upper-layer analysis tools (such as Grafana) through the MySQL interface to provide visual query and analysis capabilities
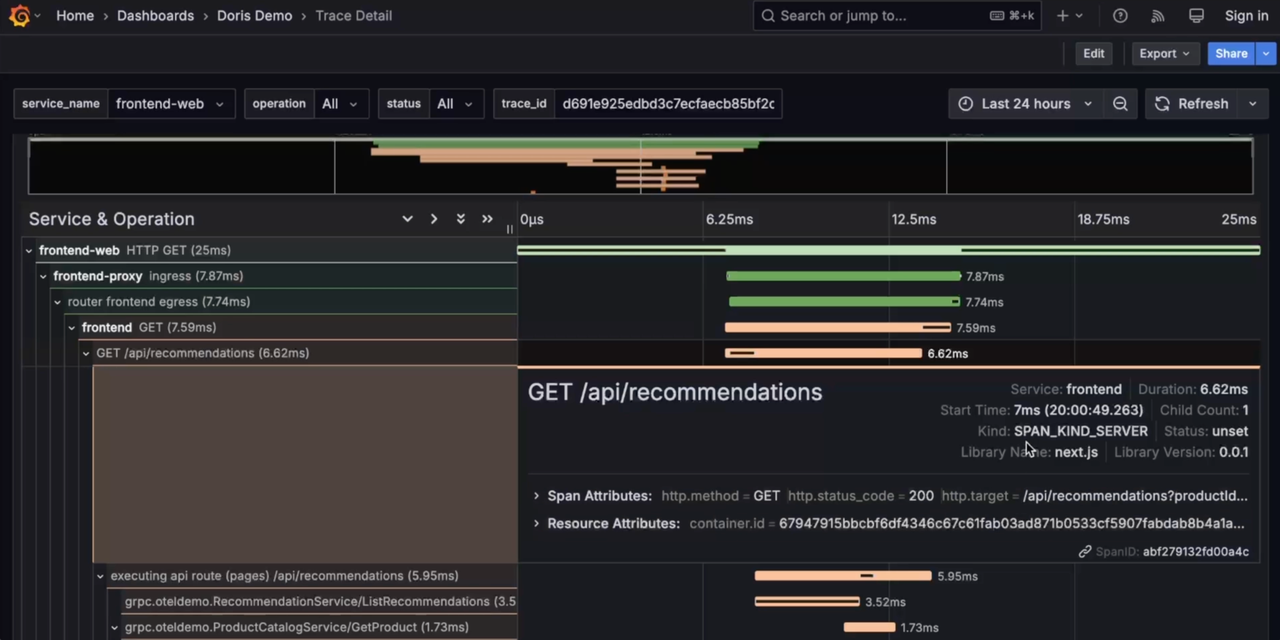
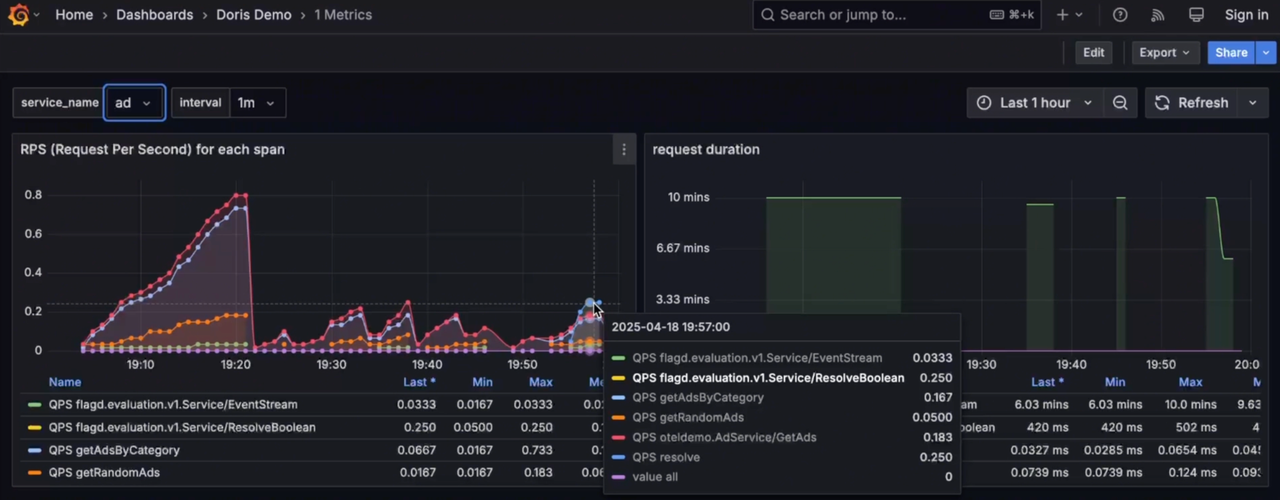
Visualization
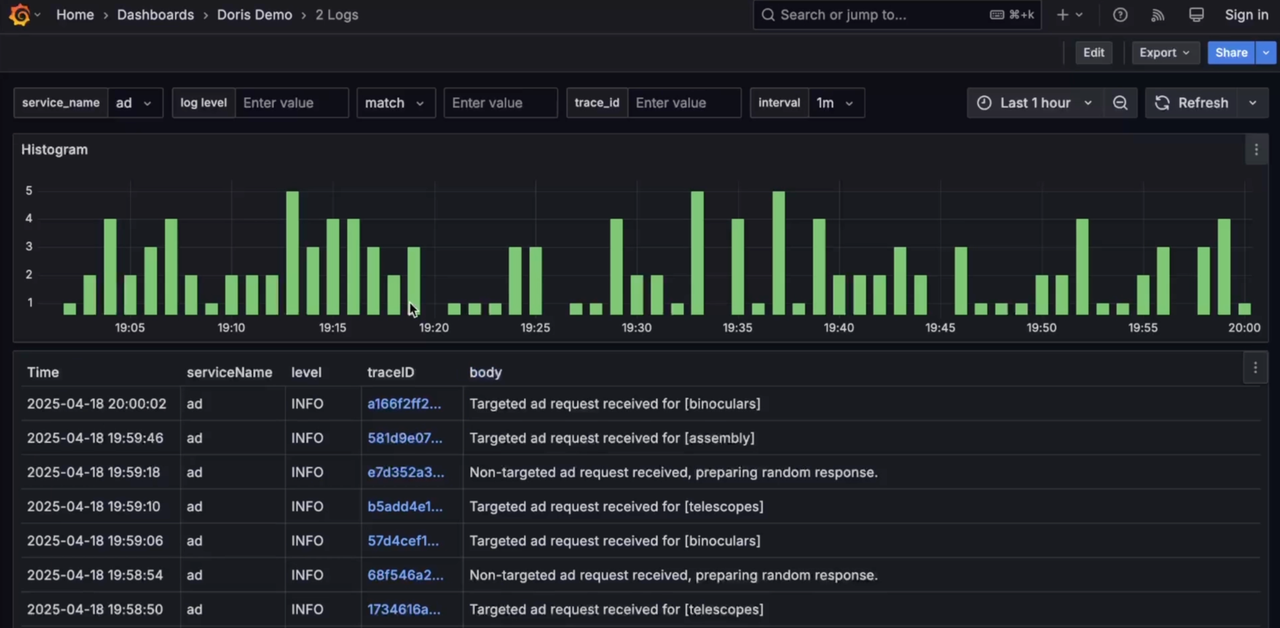
Grafana connects to Doris through the MySQL Datasource, providing unified Log, Trace, and Metrics visualization analysis with linkage between Log and Trace.
-
Log
-
Trace
-
Metrics
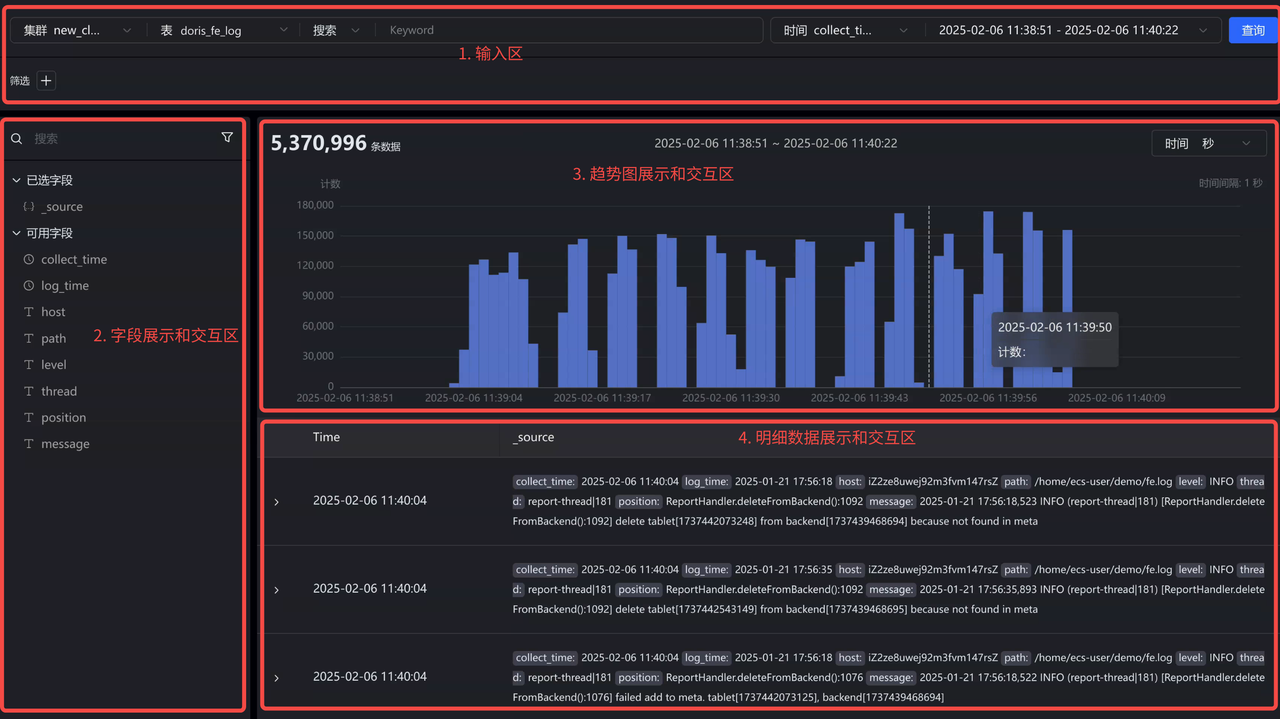
Grafana's Log visualization and analysis capabilities are relatively simple compared with Kibana, so third-party vendors have implemented Kibana Discover-like search and analysis capabilities, which will also be integrated into the Grafana Doris Datasource in the future to provide a better unified Log/Trace/Metrics visualization analysis experience. In addition, by being compatible with the Elasticsearch query protocol, native Kibana will be able to connect directly to Doris in the future. For ELK users, replacing Elasticsearch with Doris can achieve cost reduction and efficiency gains without changing log collection and visualization analysis habits.