Trace Storage and Analysis
This article describes how to store and analyze Trace data in Apache Doris, covering the full path of table creation, collection, and query.
- For the overall observability solution, see the Overview.
- For resource estimation, cluster deployment, and tuning, see Log.
Quick Navigation
The full onboarding flow consists of three steps, which you can complete in order:
| Step | Content | Goal |
|---|---|---|
| 1. Create the table | Create a Trace storage table in Doris | Optimize performance for Trace write and query patterns |
| 2. Collect | Write Trace data into Doris through OpenTelemetry | Connect the application to Collector to Doris pipeline |
| 3. Query | Visually analyze Trace data in Grafana | Search, view latency distribution, and inspect trace details |
1. Create the Table
Trace data has clear characteristics in its write and query patterns. Targeted configuration during table creation yields better performance.
1.1 Key Configuration Items
The following table summarizes the key configuration dimensions and recommended practices for table creation:
| Configuration dimension | Recommended practice | Description |
|---|---|---|
| Partitioning | RANGE partition on the time field, with dynamic partitioning enabled to manage daily partitions automatically | Automatically rolls partitions, making hot/cold separation and expiration cleanup easier |
| Sort key | Use service_name and a DATETIME-typed time field as the key | Speeds up queries that scan a specific service over a time range by several times |
| Bucket count | Roughly 3 times the total number of disks in the cluster | Balances parallelism with control over small files |
| Bucketing strategy | Use RANDOM together with single tablet imports during writes | Improves write batching |
| Compaction | Use the time_series compaction policy | Reduces write amplification, which is critical for resource optimization under high-throughput Trace writes |
| Semi-structured fields | Use the VARIANT type for span_attributes and resource_attributes | Automatically splits JSON into sub-columns for storage, improving compression and sub-column filter and analysis performance |
| Indexes | Create inverted indexes on commonly queried fields | Speeds up equality filters and range queries |
| Full-text search | Specify the tokenizer through the parser parameter (typically unicode is sufficient), and enable support_phrase as needed | support_phrase enables phrase queries; turn it off when not needed to reduce storage space |
| Replicas | Cloud disks can use 1 replica; physical disks should use at least 2 replicas | Balances reliability with cost |
| Hot/cold separation | Configure the log_s3 object storage and the log_policy_3day policy | Data older than 3 days is automatically moved to S3, reducing hot storage cost |
1.2 Table Creation SQL Example
The following example covers the full creation process for the resource, storage policy, and table:
CREATE DATABASE log_db;
USE log_db;

-- Not required in the storage-compute decoupled mode
CREATE RESOURCE "log_s3"
PROPERTIES
(
    "type" = "s3",
    "s3.endpoint" = "your_endpoint_url",
    "s3.region" = "your_region",
    "s3.bucket" = "your_bucket",
    "s3.root.path" = "your_path",
    "s3.access_key" = "your_ak",
    "s3.secret_key" = "your_sk"
);

-- Not required in the storage-compute decoupled mode
CREATE STORAGE POLICY log_policy_3day
PROPERTIES(
    "storage_resource" = "log_s3",
    "cooldown_ttl" = "259200"
);

CREATE TABLE trace_table
(
    service_name          VARCHAR(200),
    timestamp             DATETIME(6),
    service_instance_id   VARCHAR(200),
    trace_id              VARCHAR(200),
    span_id               STRING,
    trace_state           STRING,
    parent_span_id        STRING,
    span_name             STRING,
    span_kind             STRING,
    end_time              DATETIME(6),
    duration              BIGINT,
    span_attributes       VARIANT,
    events                ARRAY<STRUCT<timestamp:DATETIME(6), name:STRING, attributes:MAP<STRING, STRING>>>,
    links                 ARRAY<STRUCT<trace_id:STRING, span_id:STRING, trace_state:STRING, attributes:MAP<STRING, STRING>>>,
    status_message        STRING,
    status_code           STRING,
    resource_attributes   VARIANT,
    scope_name            STRING,
    scope_version         STRING,
    INDEX idx_timestamp(timestamp) USING INVERTED,
    INDEX idx_service_instance_id(service_instance_id) USING INVERTED,
    INDEX idx_trace_id(trace_id) USING INVERTED,
    INDEX idx_span_id(span_id) USING INVERTED,
    INDEX idx_trace_state(trace_state) USING INVERTED,
    INDEX idx_parent_span_id(parent_span_id) USING INVERTED,
    INDEX idx_span_name(span_name) USING INVERTED,
    INDEX idx_span_kind(span_kind) USING INVERTED,
    INDEX idx_end_time(end_time) USING INVERTED,
    INDEX idx_duration(duration) USING INVERTED,
    INDEX idx_span_attributes(span_attributes) USING INVERTED,
    INDEX idx_status_message(status_message) USING INVERTED,
    INDEX idx_status_code(status_code) USING INVERTED,
    INDEX idx_resource_attributes(resource_attributes) USING INVERTED,
    INDEX idx_scope_name(scope_name) USING INVERTED,
    INDEX idx_scope_version(scope_version) USING INVERTED
)
ENGINE = OLAP
DUPLICATE KEY(service_name, timestamp)
PARTITION BY RANGE(timestamp) ()
DISTRIBUTED BY RANDOM BUCKETS 250
PROPERTIES (
"compression" = "zstd",
"compaction_policy" = "time_series",
"inverted_index_storage_format" = "V2",
"dynamic_partition.enable" = "true",
"dynamic_partition.create_history_partition" = "true",
"dynamic_partition.time_unit" = "DAY",
"dynamic_partition.start" = "-30",
"dynamic_partition.end" = "1",
"dynamic_partition.prefix" = "p",
"dynamic_partition.buckets" = "250",
"dynamic_partition.replication_num" = "2", -- Not required in storage-compute decoupled mode
"replication_num" = "2", -- Not required in storage-compute decoupled mode
"storage_policy" = "log_policy_3day" -- Not required in storage-compute decoupled mode
);
2. Trace Collection
Doris provides an open and general Stream HTTP API that integrates with Trace collection systems such as OpenTelemetry.
2.1 Overall Pipeline
Application to OpenTelemetry SDK/Agent to OpenTelemetry Collector (with Doris Exporter) to Doris table.
2.2 OpenTelemetry Integration Steps
Step 1: Integrate the OpenTelemetry SDK on the Application Side
This example uses the official Spring Boot demo integrated with the OpenTelemetry Java SDK, returning a simple Hello World! string for the path /.
Download the OpenTelemetry Java Agent. The advantage of using the Java Agent is that no modifications to the existing application are required.
For other languages and integration methods, see:
Step 2: Deploy and Configure the OpenTelemetry Collector
Download the OpenTelemetry Collector and extract it.
Download the release package whose name is prefixed with
otelcol-contrib. It includes the Doris Exporter component, which can import Trace data into Doris.
Create the otel_demo.yaml configuration file as follows. For more configuration options, see the Doris Exporter documentation:
receivers:
    otlp: # otlp protocol, receives data sent by the OpenTelemetry Java Agent
        protocols:
            grpc:
                endpoint: 0.0.0.0:4317
            http:
                endpoint: 0.0.0.0:4318

processors:
    batch:
        send_batch_size: 100000 # Number of records per batch; recommended batch size is between 100M and 1G
        timeout: 10s

exporters:
    doris:
        endpoint: http://localhost:8030 # FE HTTP address
        database: doris_db_name
        username: doris_username
        password: doris_password
        table:
            traces: doris_table_name
        create_schema: true # Whether to automatically create the schema; when set to false, you need to create the table manually
        mysql_endpoint: localhost:9030  # FE MySQL address
        history_days: 10
        create_history_days: 10
        timezone: Asia/Shanghai
        timeout: 60s # http stream load client timeout
        log_response: true
        sending_queue:
            enabled: true
            num_consumers: 20
            queue_size: 1000
        retry_on_failure:
            enabled: true
            initial_interval: 5s
            max_interval: 30s
        headers:
            load_to_single_tablet: "true"
Step 3: Run the OpenTelemetry Collector
./otelcol-contrib --config otel_demo.yaml
Step 4: Start the Spring Boot Sample Application
Before starting the application, only a few environment variables need to be set; no code changes are required:
export JAVA_TOOL_OPTIONS="${JAVA_TOOL_OPTIONS} -javaagent:/your/path/to/opentelemetry-javaagent.jar" # Path to the OpenTelemetry Java Agent
export OTEL_JAVAAGENT_LOGGING="none" # Disable otel logging to avoid interfering with the service's own logs
export OTEL_SERVICE_NAME="myproject"
export OTEL_TRACES_EXPORTER="otlp" # Use the otlp protocol to send trace data
export OTEL_EXPORTER_OTLP_ENDPOINT="http://localhost:4317" # Address of the OpenTelemetry Collector

java -jar myproject-0.0.1-SNAPSHOT.jar
Step 5: Access the Sample Application and Generate Trace Data
Run curl localhost:8080 to trigger the hello service call. The OpenTelemetry Java Agent automatically generates Trace data and sends it to the OpenTelemetry Collector. The Collector then writes the Trace data into a Doris table through the configured Doris Exporter (the default table name is otel.otel_traces).
3. Trace Query
Trace queries are typically performed through a visual interface such as Grafana. Common scenarios include:
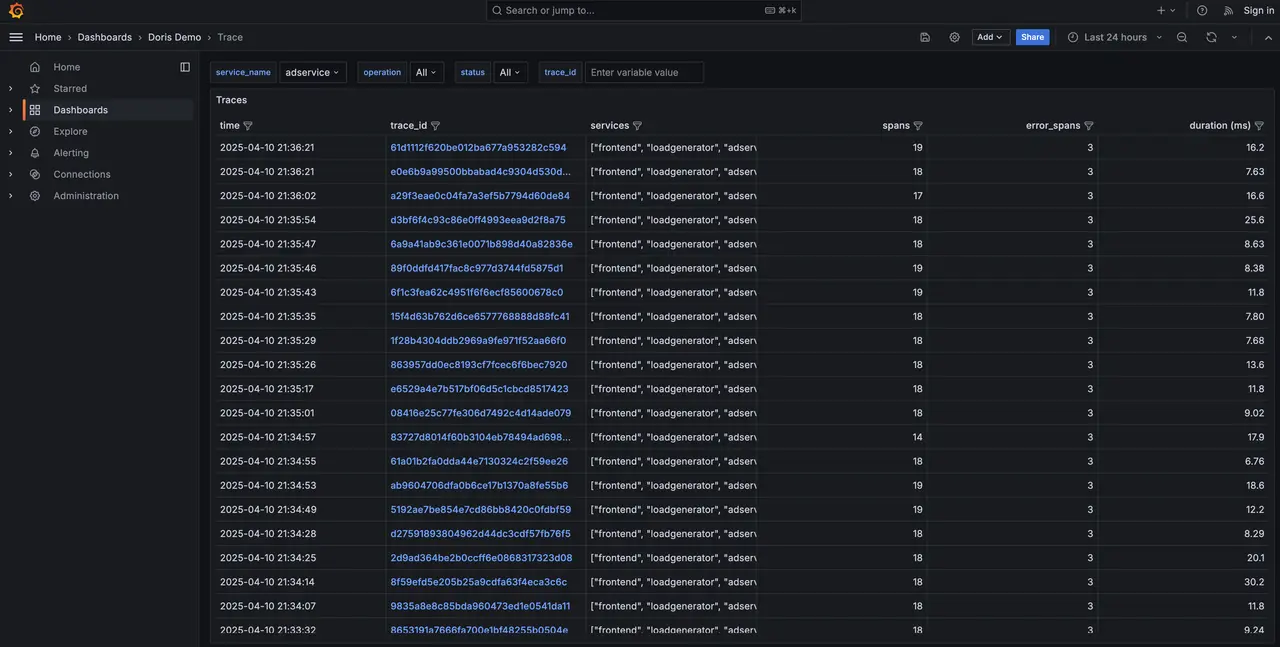
-
Filter by time range and service name to display a Trace overview, including the latency distribution chart and the most recent traces.
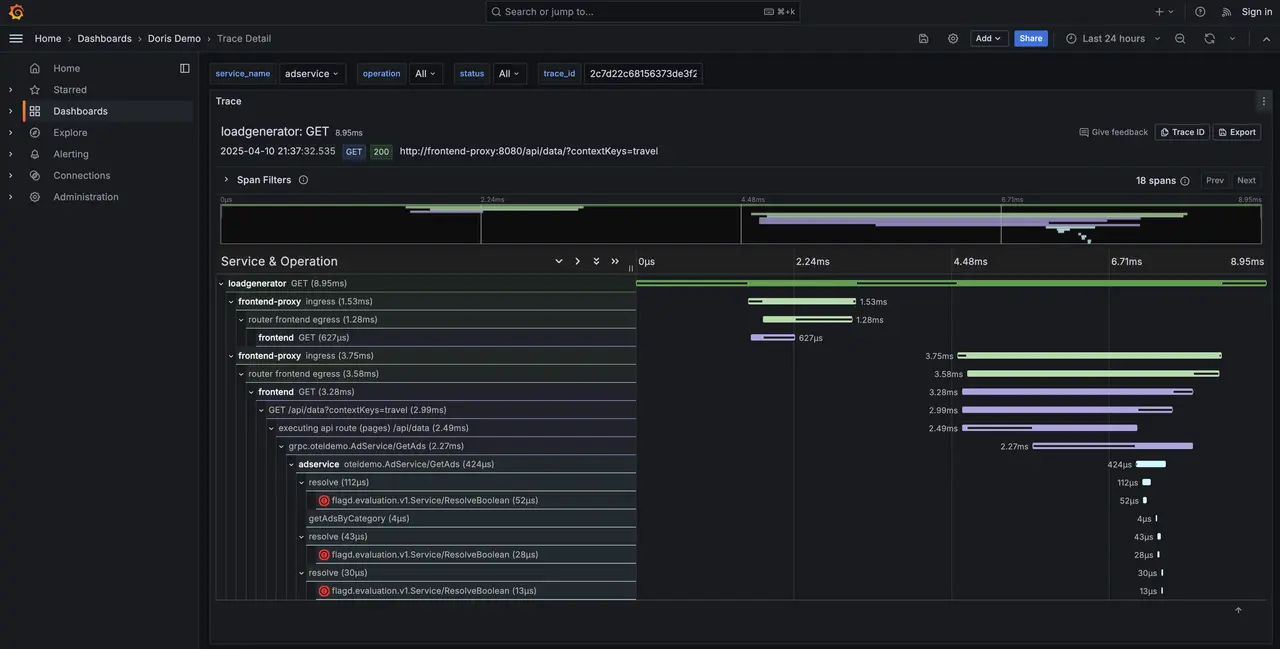
-
Click a link to view Trace details.