느린 SQL 진단 도구: 감사 로그와 감사 테이블
성능 진단 도구는 문제가 있는 업무 SQL을 빠르게 찾는 데 사용되며, 데이터베이스 SLA를 유지하는 데 필수적입니다. 기본적으로 Doris는 실행 시간이 5초를 초과하는 SQL을 느린 SQL로 간주합니다. 이 기준값은 config.qe_slow_log_ms로 설정할 수 있습니다.
시작 전 확인 사항:
- 느린 SQL 기준값을 알고 있는지 확인합니다(기본값 5000 ms).
- FE 노드의
fe/log/fe.audit.log파일에 접근할 수 있는지 확인합니다. - Doris 2.1 이상 버전을 사용하는지 확인합니다(시스템 테이블 방식에 필요).
- Doris Manager가 배포되어 있는지 확인합니다(선택 사항이며, UI 기반 필터링에 사용).
세 가지 진단 경로 비교:
| 도구 | 활용 상황 | 접근 방법 | Doris Manager 필요 여부 | 버전 요구 사항 |
|---|---|---|---|---|
| Doris Manager 로그 | UI 기반 느린 SQL 필터링 | Doris Manager 콘솔 | 필요 | 모든 버전 |
감사 로그 (fe.audit.log) | 원본 로그 직접 확인, 텍스트 기반 필터링 | FE 노드의 파일 | 불필요 | 모든 버전 |
audit_log 시스템 테이블 | SQL 기반 통계 및 집계 분석 | MySQL 클라이언트 쿼리 | 불필요 | 2.1+ |
Doris Manager 로그
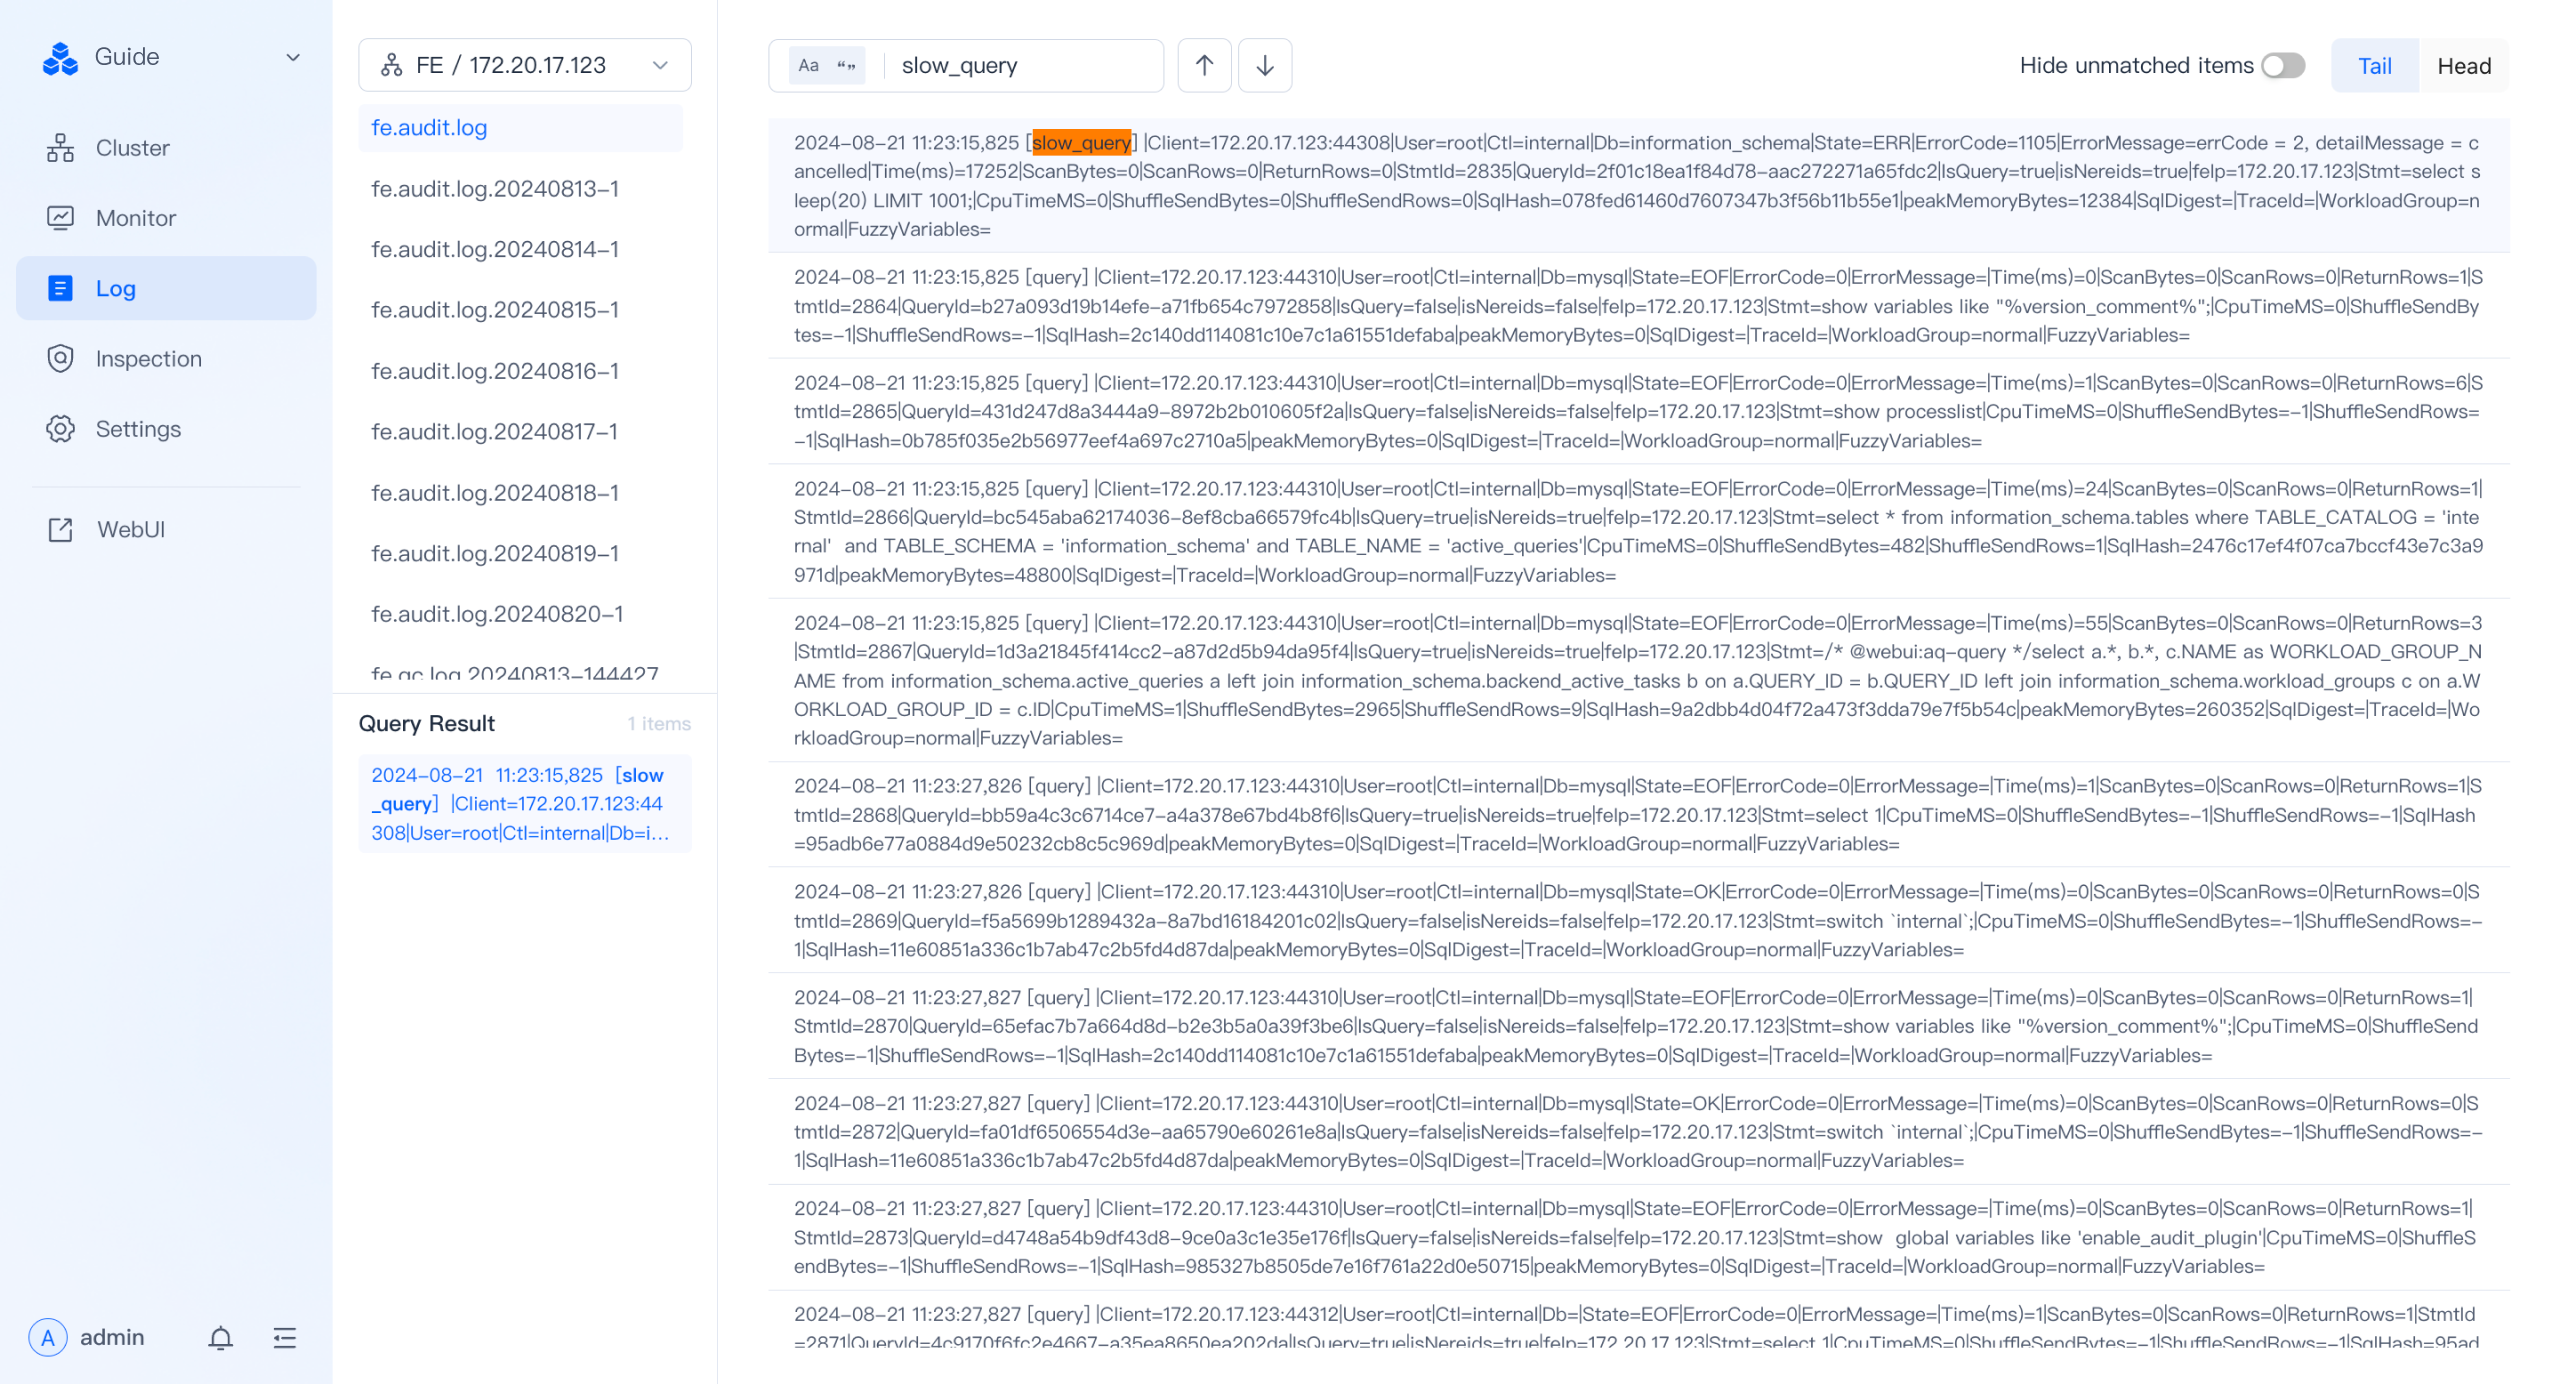
Doris Manager의 로그 모듈은 느린 SQL 필터링 기능을 제공합니다.
절차:
- 목표: 과거의 느린 SQL을 확인합니다.
- 작업: 로그 페이지에서 특정 FE 노드의
fe.audit.log를 선택합니다. - 설명: 검색창에
slow_query를 입력하면 페이지에서 느린 SQL 목록을 확인할 수 있습니다.
감사 로그
감사 로그는 Doris FE가 출력하는 로그입니다. Doris Manager 로그 페이지에서 확인할 수 있으며, FE 노드의 fe/log/fe.audit.log 파일에 직접 접근할 수도 있습니다.
감사 로그 유형:
| 유형 | 설명 |
|---|---|
slow_query | 실행 시간이 기준값을 초과하는 느린 쿼리 |
query | 일반 쿼리 |
load | 데이터 적재 작업 |
stream_load | Stream Load 데이터 적재 |
fe.audit.log에서 느린 쿼리 직접 필터링
slow_query 태그를 사용하면 fe.audit.log에서 느린 쿼리를 빠르게 필터링할 수 있습니다. 로그 예시는 다음과 같습니다.
2024-07-18 11:23:13,042 [slow_query] |Client=127.0.0.1:63510|User=root|Ctl=internal|Db=tpch_sf1000|State=EOF|ErrorCode=0|ErrorMessage=|Time(ms)=11603|ScanBytes=236667379712|ScanRows=13649979418|ReturnRows=100|StmtId=1689|QueryId=91ff336304f14182-9ca537eee75b3856|IsQuery=true|isNereids=true|feIp=172.21.0.10|Stmt=select     c_name,     c_custkey,     o_orderkey,     o_orderdate,     o_totalprice,     sum(l_quantity) from     customer,     orders,     lineitem where     o_orderkey  in  (         select             l_orderkey         from             lineitem         group  by             l_orderkey  having                 sum(l_quantity)  >  300     )     and  c_custkey  =  o_custkey     and  o_orderkey  =  l_orderkey group  by     c_name,     c_custkey,     o_orderkey,     o_orderdate,     o_totalprice order  by     o_totalprice  desc,     o_orderdate limit  100|CpuTimeMS=918556|ShuffleSendBytes=3267419|ShuffleSendRows=89668|SqlHash=b4e1de9f251214a30188180f37907f7d|peakMemoryBytes=38720935552|SqlDigest=f23c7a7ecff61da33f537b2699e9b053|cloudClusterName=UNKNOWN|TraceId=|WorkloadGroup=normal|FuzzyVariables=|scanBytesFromLocalStorage=0|scanBytesFromRemoteStorage=0
2024-07-18 11:23:33,043 [slow_query] |Client=127.0.0.1:26672|User=root|Ctl=internal|Db=tpch_sf1000|State=EOF|ErrorCode=0|ErrorMessage=|Time(ms)=8978|ScanBytes=334985555968|ScanRows=10717654374|ReturnRows=100|StmtId=1815|QueryId=6e1fae453cb04d9a-b1e5f94d9cea1885|IsQuery=true|isNereids=true|feIp=172.21.0.10|Stmt=select     s_name,     count(*) as numwait from     supplier,     lineitem l1,     orders,     nation where     s_suppkey = l1.l_suppkey     and o_orderkey = l1.l_orderkey     and o_orderstatus = 'F'     and l1.l_receiptdate > l1.l_commitdate     and exists (         select             *         from             lineitem l2         where                 l2.l_orderkey = l1.l_orderkey           and l2.l_suppkey <> l1.l_suppkey     )     and not exists (         select             *         from             lineitem l3         where                 l3.l_orderkey = l1.l_orderkey           and l3.l_suppkey <> l1.l_suppkey           and l3.l_receiptdate > l3.l_commitdate     )     and s_nationkey = n_nationkey     and n_name = 'SAUDI ARABIA' group by     s_name order by     numwait desc,     s_name limit 100|CpuTimeMS=990127|ShuffleSendBytes=59208164|ShuffleSendRows=3651504|SqlHash=f8a30e4182d72cce3eff6cb385005b1f|peakMemoryBytes=10495660672|SqlDigest=fec5a7136f9375aa968a4de971b994da|cloudClusterName=UNKNOWN|TraceId=|WorkloadGroup=normal|FuzzyVariables=|scanBytesFromLocalStorage=0|scanBytesFromRemoteStorage=0
2024-07-18 11:23:41,044 [slow_query] |Client=127.0.0.1:26684|User=root|Ctl=internal|Db=tpch_sf1000|State=EOF|ErrorCode=0|ErrorMessage=|Time(ms)=8514|ScanBytes=334986551296|ScanRows=10717654374|ReturnRows=100|StmtId=1833|QueryId=4f91483464ce4aa8-beeed7dcb8675bc8|IsQuery=true|isNereids=true|feIp=172.21.0.10|Stmt=select     s_name,     count(*) as numwait from     supplier,     lineitem l1,     orders,     nation where     s_suppkey = l1.l_suppkey     and o_orderkey = l1.l_orderkey     and o_orderstatus = 'F'     and l1.l_receiptdate > l1.l_commitdate     and exists (         select             *         from             lineitem l2         where                 l2.l_orderkey = l1.l_orderkey           and l2.l_suppkey <> l1.l_suppkey     )     and not exists (         select             *         from             lineitem l3         where                 l3.l_orderkey = l1.l_orderkey           and l3.l_suppkey <> l1.l_suppkey           and l3.l_receiptdate > l3.l_commitdate     )     and s_nationkey = n_nationkey     and n_name = 'SAUDI ARABIA' group by     s_name order by     numwait desc,     s_name limit 100|CpuTimeMS=925841|ShuffleSendBytes=59223190|ShuffleSendRows=3651602|SqlHash=f8a30e4182d72cce3eff6cb385005b1f|peakMemoryBytes=10505123104|SqlDigest=fec5a7136f9375aa968a4de971b994da|cloudClusterName=UNKNOWN|TraceId=|WorkloadGroup=normal|FuzzyVariables=|scanBytesFromLocalStorage=0|scanBytesFromRemoteStorage=0
2024-07-18 11:23:49,044 [slow_query] |Client=127.0.0.1:10748|User=root|Ctl=internal|Db=tpch_sf1000|State=EOF|ErrorCode=0|ErrorMessage=|Time(ms)=8660|ScanBytes=334987673600|ScanRows=10717654374|ReturnRows=100|StmtId=1851|QueryId=4599cb1bab204f80-ac430dd78b45e3da|IsQuery=true|isNereids=true|feIp=172.21.0.10|Stmt=select     s_name,     count(*) as numwait from     supplier,     lineitem l1,     orders,     nation where     s_suppkey = l1.l_suppkey     and o_orderkey = l1.l_orderkey     and o_orderstatus = 'F'     and l1.l_receiptdate > l1.l_commitdate     and exists (         select             *         from             lineitem l2         where                 l2.l_orderkey = l1.l_orderkey           and l2.l_suppkey <> l1.l_suppkey     )     and not exists (         select             *         from             lineitem l3         where                 l3.l_orderkey = l1.l_orderkey           and l3.l_suppkey <> l1.l_suppkey           and l3.l_receiptdate > l3.l_commitdate     )     and s_nationkey = n_nationkey     and n_name = 'SAUDI ARABIA' group by     s_name order by     numwait desc,     s_name limit 100|CpuTimeMS=932664|ShuffleSendBytes=59223178|ShuffleSendRows=3651991|SqlHash=f8a30e4182d72cce3eff6cb385005b1f|peakMemoryBytes=10505123104|SqlDigest=fec5a7136f9375aa968a4de971b994da|cloudClusterName=UNKNOWN|TraceId=|WorkloadGroup=normal|FuzzyVariables=|scanBytesFromLocalStorage=0|scanBytesFromRemoteStorage=0
fe.audit.log는 실행 시간, 스캔한 행 수, 반환된 행 수, SQL 문 등 느린 SQL에 관한 핵심 정보를 제공하며, 이는 이후 문제를 재현하고 최적화하는 데 기초가 됩니다.
주요 필드 참조
| 필드 | 의미 |
|---|---|
Time(ms) | 쿼리 실행 시간(밀리초) |
ScanBytes / ScanRows | 스캔한 데이터 양과 행 수 |
ReturnRows | 클라이언트에 반환된 행 수 |
QueryId | Profile과 연결하는 데 사용하는 고유 쿼리 ID |
Stmt | 전체 SQL 문 |
SqlDigest | SQL 구조의 해시로, 동일한 패턴의 SQL을 집계하는 데 사용 |
CpuTimeMS | 총 CPU 시간(밀리초) |
peakMemoryBytes | 최대 메모리 사용량 |
WorkloadGroup | 쿼리가 속한 Workload Group |
SqlDigest를 사용한 패턴별 집계
SqlDigest는 구체적인 매개변수를 제거한 SQL 구조에서 생성한 해시 값입니다. 구조가 같은 SQL 문은 동일한 SqlDigest를 가지므로, 느린 SQL을 패턴별로 집계하고 분석할 수 있습니다.
SqlDigest를 기반으로 가장 자주 실행되거나 총 실행 시간이 가장 긴 SQL 패턴을 파악하고, 해당 패턴을 우선적으로 최적화할 수 있습니다. 이 방법은 SQL 문을 하나씩 분석할 필요 없이 최적화 효율을 크게 높여 줍니다.
참고: SqlDigest는 해시 값이므로 그 자체로는 내용을 해석할 수 없습니다. 최적화할 패턴을 결정한 후에는 Stmt 필드에서 실제 SQL을 확인하고, QueryId를 사용해 Profile과 연결하여 심층 분석해야 합니다(Profile은 이후 장에서 설명합니다).
느린 쿼리 분석 예시
위의 느린 쿼리 로그 네 개를 예로 들어 보겠습니다.
- 첫 번째 항목의
SqlDigest(Time(ms)=11603)는f23c7a7ecff61da33f537b2699e9b053입니다. - 그다음 세 항목의
SqlDigest(Time(ms)=8978/8514/8660)는fec5a7136f9375aa968a4de971b994da입니다.
마지막 세 항목은 실행 세부 정보가 다르지만, 동일한 SQL 패턴에 속합니다(구조가 같음).
실제 최적화 과정에서 특정 SqlDigest(예: fec5a7136f9375aa968a4de971b994da)가 반복적으로 나타나거나 누적 실행 시간에서 차지하는 비중이 크다면, 이를 우선적으로 살펴봐야 합니다.
최적화 단계:
-
업무 로직 파악: 이 패턴에 속한 로그 항목 중 하나의
Stmt필드를 사용해 업무 SQL을 확인합니다.select s_name, count(*) as numwait from supplier, lineitem l1, orders, nation where ... -
심층 분석:
QueryId(예:6e1fae453cb04d9a-b1e5f94d9cea1885)를 사용해 해당 Query Profile을 찾습니다. Profile에서 병목 지점(과도한 데이터 스캔, 긴 Join 시간 등)을 파악하고 최적화 전략(인덱스 추가, SQL 재작성, 테이블 구조 조정 등)을 수립합니다.
이 패턴의 문제를 해결하면 동일한 패턴의 모든 느린 쿼리에 개선 효과가 적용됩니다.
audit_log 시스템 테이블
Doris 2.1 이상 버전은 audit_log 시스템 테이블을 __internal_schema 데이터베이스에서 제공하므로, SQL로 감사 정보를 조회할 수 있습니다.
활성화 단계
| 단계 | 명령어 | 설명 |
|---|---|---|
| 1. 플러그인 활성화 | set global enable_audit_plugin=true; | 감사 플러그인을 전역으로 활성화합니다. 기본적으로 비활성화되어 있습니다 |
| 2. 데이터베이스 전환 | use __internal_schema; | 내부 스키마로 전환합니다 |
| 3. 테이블 표시 | show tables; | audit_log 테이블이 있는지 확인합니다 |
확인 예시
mysql> use __internal_schema;
Reading table information for completion of table and column names
You can turn off this feature to get a quicker startup with -A

Database changed
mysql> show tables;
+-----------------------------+
| Tables_in___internal_schema |
+-----------------------------+
| audit_log                   |
| column_statistics           |
| histogram_statistics        |
| partition_statistics        |
+-----------------------------+
4 rows in set (0.00 sec)

mysql> desc audit_log;
+-------------------+--------------+------+-------+---------+-------+
| Field             | Type         | Null | Key   | Default | Extra |
+-------------------+--------------+------+-------+---------+-------+
| query_id          | varchar(48)  | Yes  | true  | NULL    |       |
| time              | datetime     | Yes  | true  | NULL    |       |
| client_ip         | varchar(128) | Yes  | true  | NULL    |       |
| user              | varchar(128) | Yes  | false | NULL    | NONE  |
| catalog           | varchar(128) | Yes  | false | NULL    | NONE  |
| db                | varchar(128) | Yes  | false | NULL    | NONE  |
| state             | varchar(128) | Yes  | false | NULL    | NONE  |
| error_code        | int          | Yes  | false | NULL    | NONE  |
| error_message     | text         | Yes  | false | NULL    | NONE  |
| query_time        | bigint       | Yes  | false | NULL    | NONE  |
| scan_bytes        | bigint       | Yes  | false | NULL    | NONE  |
| scan_rows         | bigint       | Yes  | false | NULL    | NONE  |
| return_rows       | bigint       | Yes  | false | NULL    | NONE  |
| stmt_id           | bigint       | Yes  | false | NULL    | NONE  |
| is_query          | tinyint      | Yes  | false | NULL    | NONE  |
| frontend_ip       | varchar(128) | Yes  | false | NULL    | NONE  |
| cpu_time_ms       | bigint       | Yes  | false | NULL    | NONE  |
| sql_hash          | varchar(128) | Yes  | false | NULL    | NONE  |
| sql_digest        | varchar(128) | Yes  | false | NULL    | NONE  |
| peak_memory_bytes | bigint       | Yes  | false | NULL    | NONE  |
| stmt              | text         | Yes  | false | NULL    | NONE  |
+-------------------+--------------+------+-------+---------+-------+
audit_log 내부 테이블을 통해 SQL로 상세 실행 정보를 조회하고, 느린 쿼리 필터링과 통계 분석을 수행할 수 있습니다.
자주 묻는 질문
Q1: slow_query 레코드가 fe.audit.log에 보이지 않는 이유는 무엇인가요?
- 원인: SQL 실행 시간이 기준값(기본값 5000 ms)에 도달하지 않았습니다.
- 해결 방법:
config.qe_slow_log_ms로 기준값을 조정합니다.
Q2: audit_log 테이블을 조회해도 데이터가 반환되지 않는 이유는 무엇인가요?
- 원인:
enable_audit_plugin은 기본적으로 비활성화되어 있습니다. - 해결 방법:
set global enable_audit_plugin=true;를 실행합니다.
Q3: 실제 SQL 텍스트가 다른데 SqlDigest가 같아도 정상인가요?
- 네.
SqlDigest는 매개변수 값을 제거한 구조를 기반으로 생성됩니다. 패턴이 같고 매개변수만 다른 SQL 문은 동일한 해시 값을 가집니다.
Q4: audit_log 테이블은 어디에서 찾을 수 있나요?
__internal_schema데이터베이스에 있으며, Doris 2.1 이상 버전이 필요합니다.
Q5: 심층 분석을 위해 Profile과 어떻게 연결하나요?
- 감사 로그의
QueryId필드를 사용해 Profile 시스템에서 해당 실행 계획을 조회합니다.
요약
Doris는 Doris Manager 로그, fe.audit.log, audit_log 시스템 테이블이라는 세 가지 느린 SQL 진단 경로를 제공합니다. 각각 UI 기반 필터링, 텍스트 직접 확인, SQL 기반 통계라는 세 가지 사용 상황에 대응합니다. SqlDigest를 통한 집계 분석과 QueryId를 통한 Profile 연계를 결합하면 성능 병목을 체계적으로 찾아 최적화할 수 있습니다.