概述
Apache Doris 提供 Query Profile 用于展示查询执行细节。本文介绍 Query Profile 的整体架构与常用实践,主要包括:
- 采集流程:Profile 如何从各 Backend 收集并在 Frontend 存储。
- 采集相关参数:如何配置以过滤无用信息,专注关键查询细节。
- 解读方法:如何快速定位影响查询性能的算子。
Query Profile 的整体架构
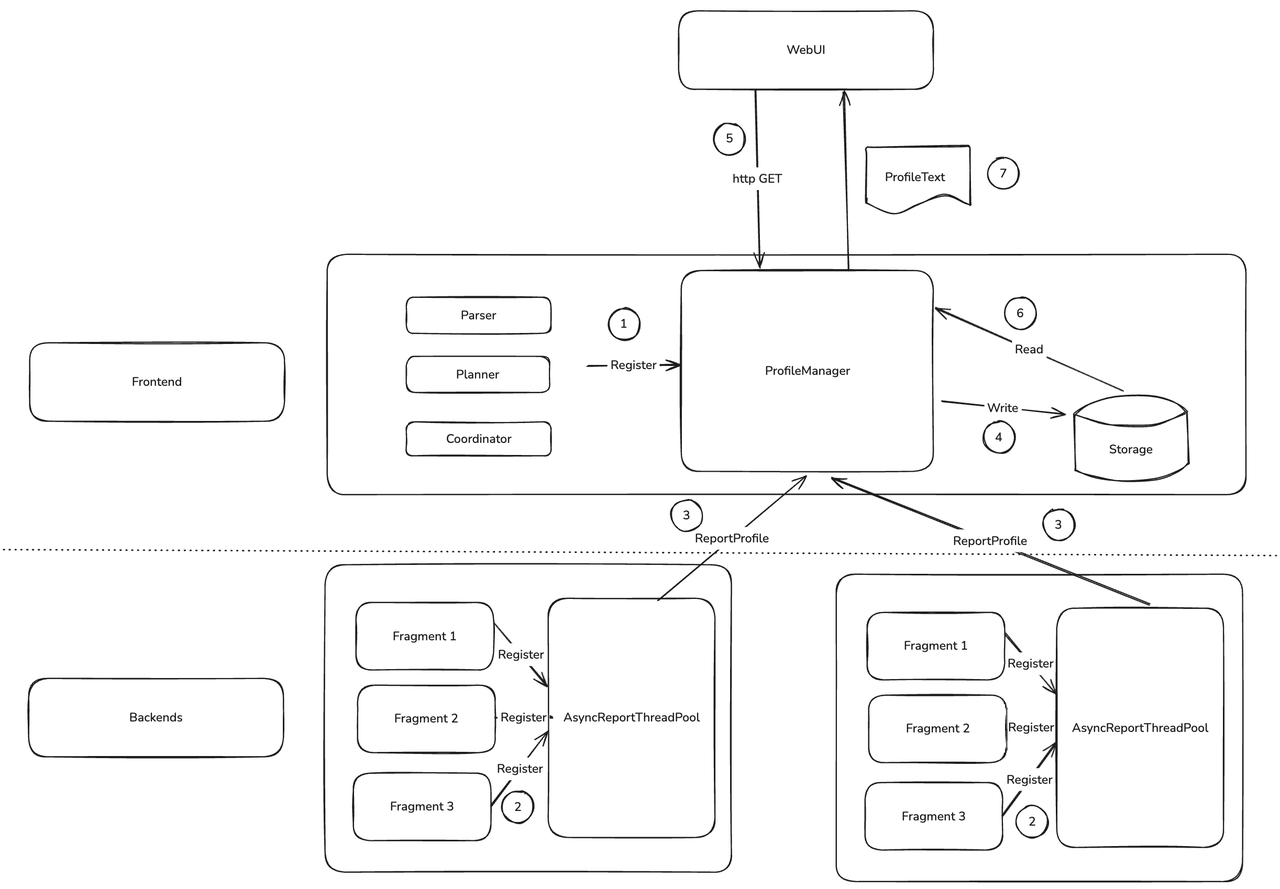
Query Profile 的核心由两部分组成:FE 的 ProfileManager 与 BE 的 AsyncReportThreadPool。
- 用户发起查询时,FE 在查询开始前将 Profile 相关数据结构注册到
ProfileManager。 - BE 的每个查询完成后,会将自身的 Profile 作为任务注册到用于异步上报至 FE 的线程池。
- BE 的
AsyncReportThreadPool以查询为粒度发起 RPC,将 Profile 数据发送到 FE。 - FE 侧后台线程处理并管理收集到的 Profile,按策略决定保留与淘汰,并将合适的 Profile 压缩后写入存储。
- 用户通过 Web UI 或 curl 发送 HTTP 请求查看 Profile。
ProfileManager会从内存或外部存储中查找 Profile,并以文本形式返回。
整个收集流程中,第二步的异步汇报与第四步的 Profile 持久化对 Profile 功能影响最大。
在集群压力较大时,异步汇报可能出现超时。为避免 FE 侧占用过多内存,ProfileManager 会在等待一段时间后放弃超时的 Profile。可调整 fe.conf 中的 profile_async_collect_expire_time_secs 控制等待时长。若频繁超时,建议优先检查机器资源使用率;必要时可关闭全局 Profile 以降低风险。
ProfileManager 把 Profile 持久化到磁盘后,可以确保:
- Profile 不再占据 FE 的大量内存
- FE 重启后依然能够查询到之前的 Profile
前者使 FE 能够保留数千份完整 Profile,后者便于对比集群升级前后的表现,从而验证版本升级是否提升 Doris 查询性能。
配置Profile
开启 Profile
enable_profile
当该参数为 false 时,不会生成 Profile。默认值为 false。
mysql> select 1;
--------------
select 1
--------------

+------+
| 1    |
+------+
|    1 |
+------+
1 row in set (0.00 sec)

mysql> show query profile;
--------------
show query profile
--------------

+-----------------------------------+-----------+---------------------+---------------------+-------+------------+------+-----------------+------------+---------------+
| Profile ID                        | Task Type | Start Time          | End Time            | Total | Task State | User | Default Catalog | Default Db | Sql Statement |
+-----------------------------------+-----------+---------------------+---------------------+-------+------------+------+-----------------+------------+---------------+
| 74b9e30d6ba7491d-9dbf9289f6f5c208 | QUERY     | 2025-02-26 18:47:07 | 2025-02-26 18:47:07 | 4ms   | EOF        | root | internal        | tpcds      | select 1      |
+-----------------------------------+-----------+---------------------+---------------------+-------+------------+------+-----------------+------------+---------------+
1 row in set (0.01 sec)

mysql> set enable_profile=false;
--------------
set enable_profile=false
--------------

Query OK, 0 rows affected (0.00 sec)

mysql> select 1;
--------------
select 1
--------------

+------+
| 1    |
+------+
|    1 |
+------+
1 row in set (0.01 sec)

mysql> show query profile;
--------------
show query profile
--------------

+-----------------------------------+-----------+---------------------+---------------------+-------+------------+------+-----------------+------------+---------------+
| Profile ID                        | Task Type | Start Time          | End Time            | Total | Task State | User | Default Catalog | Default Db | Sql Statement |
+-----------------------------------+-----------+---------------------+---------------------+-------+------------+------+-----------------+------------+---------------+
| 74b9e30d6ba7491d-9dbf9289f6f5c208 | QUERY     | 2025-02-26 18:47:07 | 2025-02-26 18:47:07 | 4ms   | EOF        | root | internal        | tpcds      | select 1      |
+-----------------------------------+-----------+---------------------+---------------------+-------+------------+------+-----------------+------------+---------------+
1 row in set (0.00 sec)
profile_level
默认值为 1。该参数在 4.0 及 master 分支生效, 不要在 4.0 版本之前使用该参数,4.0 之前有不同的语意。
默认情况下,BE 仅汇报精简版 Profile(足以在 FE 聚合为 MergedProfile)。若需要更详细信息且尽量不影响性能,可设置 profile_level=2。目前最大为 3,level 为 3 时,部分 Counter 的采集可能影响查询性能。
例:默认情况下,EXCHANGE_OPERATOR 的 Counter 如下:
EXCHANGE_OPERATOR(id=1):
     - InstanceID: ef33b72e30b84b68-82ad027edbee5910
     - BlocksProduced: 1
     - CloseTime: 4.243us
     - ExecTime: 30.834us
     - InitTime: 20.902us
     - MemoryUsage: 0.00
     - MemoryUsagePeak: 36.00 KB
     - OpenTime: 1.93us
     - ProjectionTime: 0ns
     - RowsProduced: 10
     - WaitForDependencyTime: 0ns
       - WaitForData0: 635.324us
当 profile_level=2 时,可以看到更详细的 Counter:
EXCHANGE_OPERATOR(id=1):
     - InstanceID: 514023de1b7b41a3-9e59e43c591103a2
     - BlocksProduced: 1
     - CloseTime: 3.523us
     - CreateMergerTime: 0ns
     - DataArrivalWaitTime: 0ns
     - DecompressBytes: 0.00
     - DecompressTime: 0ns
     - DeserializeRowBatchTimer: 0ns
     - ExecTime: 28.439us
     - FilterTime: 287ns
     - FirstBatchArrivalWaitTime: 0ns
     - GetDataFromRecvrTime: 3.482us
     - InitTime: 18.258us
     - LocalBytesReceived: 36.00 KB
     - MaxFindRecvrTime(NS): 0
     - MaxWaitForWorkerTime: 0
     - MaxWaitToProcessTime: 0
     - MemoryUsage: 0.00
     - MemoryUsagePeak: 36.00 KB
     - OpenTime: 1.44us
     - ProjectionTime: 0ns
     - RemoteBytesReceived: 0.00
     - RowsProduced: 10
     - SendersBlockedTotalTimer(*): 0ns
     - WaitForDependencyTime: 0ns
       - WaitForData0: 596.708us
auto_profile_threshold_ms
auto_profile_threshold_ms:默认值 -1。该参数在 3.0 及之后版本生效。
全局开启 Profile 会产生大量数据,占用 FE CPU、内存与磁盘,并影响对时延敏感的小查询,因此 FE 会定期清理 Profile。为避免慢查询的 Profile 被清理,可通过该参数限制仅当查询耗时超过阈值时才生成与保留 Profile。默认 -1,表示所有查询都会生成 Profile。 比如假设我们开了全局的 profile,此时所有查询都会生成 profile
mysql> show query profile;
--------------
show query profile
--------------

+-----------------------------------+-----------+---------------------+---------------------+-------+------------+------+-----------------+------------+---------------+
| Profile ID                        | Task Type | Start Time          | End Time            | Total | Task State | User | Default Catalog | Default Db | Sql Statement |
+-----------------------------------+-----------+---------------------+---------------------+-------+------------+------+-----------------+------------+---------------+
| d59b04f636e49c0-bf6b6b3011c40f67  | QUERY     | 2025-02-26 18:25:59 | 2025-02-26 18:25:59 | 3ms   | EOF        | root | internal        | tpcds      | select 1      |
| f2ccb78011aa4526-9919ee76af1e57d7 | QUERY     | 2025-02-26 18:25:59 | 2025-02-26 18:25:59 | 4ms   | EOF        | root | internal        | tpcds      | select 1      |
| a8464728ebf5481d-864e3016ad22f045 | QUERY     | 2025-02-26 18:25:58 | 2025-02-26 18:25:58 | 6ms   | EOF        | root | internal        | tpcds      | select 1      |
| 912b09ea8f634c47-89e65d4fe354a94b | QUERY     | 2025-02-26 18:25:58 | 2025-02-26 18:25:58 | 4ms   | EOF        | root | internal        | tpcds      | select 1      |
| e6e6f0a3a31640bc-ad5994de0334ae8d | QUERY     | 2025-02-26 18:25:57 | 2025-02-26 18:25:57 | 4ms   | EOF        | root | internal        | tpcds      | select 1      |
| b28da27b4cc847a7-82e239320d6facc5 | QUERY     | 2025-02-26 18:25:57 | 2025-02-26 18:25:57 | 4ms   | EOF        | root | internal        | tpcds      | select 1      |
| fec3cdcd4664408c-a38508ce3a2bbe32 | QUERY     | 2025-02-26 18:24:48 | 2025-02-26 18:24:48 | 6ms   | EOF        | root | internal        | tpcds      | select 1      |
+-----------------------------------+-----------+---------------------+---------------------+-------+------------+------+-----------------+------------+---------------+
7 rows in set (0.00 sec)
如果希望不再生成这些小查询的 Profile,可以按如下步骤操作:
mysql> clean all profile;
--------------
clean all profile
--------------

Query OK, 0 rows affected (0.01 sec)

mysql> set global auto_profile_threshold_ms=1000;
--------------
set global auto_profile_threshold_ms=1000
--------------

Query OK, 0 rows affected (0.01 sec)

mysql> select 1;
--------------
select 1
--------------

+------+
| 1    |
+------+
|    1 |
+------+
1 row in set (0.05 sec)

mysql> select 1;
--------------
select 1
--------------

+------+
| 1    |
+------+
|    1 |
+------+
1 row in set (0.01 sec)

mysql> show query profile;
--------------
show query profile
--------------

Empty set (0.00 sec)
配置 Profile 存储
Doris 支持将 Profile 持久化到 FE 本地磁盘以保存更多记录。可在 fe.conf 中通过以下参数进行控制:
max_query_profile_num
默认值 500。限制 FE 内存中最多保留的 Profile 数量,超过后从最早的开始淘汰。
max_spilled_profile_num
默认值 500。限制磁盘上最多保存的 Profile 数量,超过后从最早的开始删除。
spilled_profile_storage_path
用于指定 Profile 在本地的存储目录,默认在 log 目录的 profile 子目录。
spilled_profile_storage_limit_bytes
默认 1 GB。限制磁盘上保留的 Profile 的总存储空间。
获取 Profile
通过 FE Web UI 获取
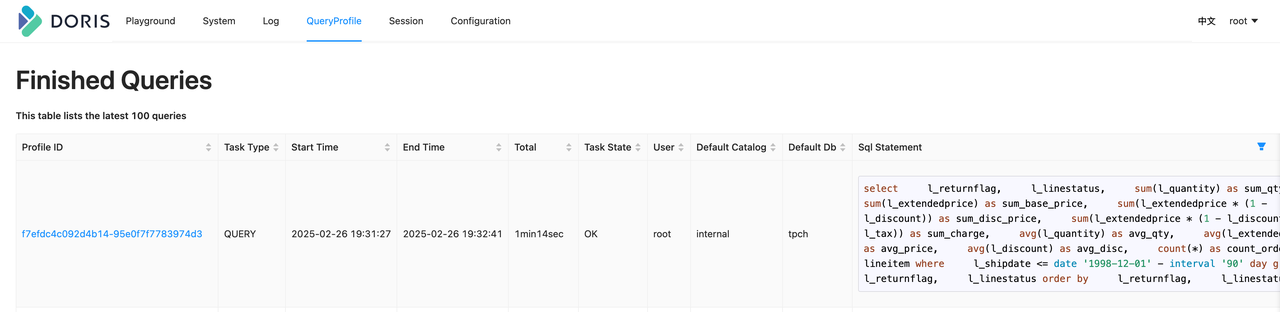
在浏览器中访问 FE 的 ip:http_port,输入用户名与密码进入 Web 页面。点击 QueryProfile 页面可查看当前 FE 中执行的所有查询的 Profile,点击 Profile ID 查看详细内容。
需要注意的是:
- Profile 仅存在于执行 SQL 的 FE 上,不会在多个 FE 之间同步;获取时需连接执行 SQL 的 FE。
- 所有导入任务最终由 FE Master 执行,因此其 Profile 需从 Master FE 获取。
通过命令行获取
在某些场景(如安全限制)下无法访问 FE 的 Web UI,可以通过命令行获取 Profile。首先使用 show query profile 获取最近 20 条 Profile 的元信息。
mysql> show query profile;
--------------
show query profile
--------------

+-----------------------------------+-----------+---------------------+---------------------+-------+------------+------+-----------------+------------+---------------+
| Profile ID                        | Task Type | Start Time          | End Time            | Total | Task State | User | Default Catalog | Default Db | Sql Statement |
+-----------------------------------+-----------+---------------------+---------------------+-------+------------+------+-----------------+------------+---------------+
| c7f48291d62147f4-92b1a511f6fe3395 | QUERY     | 2025-02-26 19:35:15 | 2025-02-26 19:35:15 | 5ms   | EOF        | root | internal        | tpch       | select 20     |
| 9c6cd24d2f354c6f-9652c097cae00b05 | QUERY     | 2025-02-26 19:35:12 | 2025-02-26 19:35:12 | 4ms   | EOF        | root | internal        | tpch       | select 19     |
| b908f7b484084492-9c4dc48762c9cb89 | QUERY     | 2025-02-26 19:35:09 | 2025-02-26 19:35:09 | 5ms   | EOF        | root | internal        | tpch       | select 18     |
| ef411c0eb00541dc-ba5a39677be3e117 | QUERY     | 2025-02-26 19:35:06 | 2025-02-26 19:35:06 | 5ms   | EOF        | root | internal        | tpch       | select 17     |
| c89deefa85974da7-ad53cb3d6f4cad75 | QUERY     | 2025-02-26 19:35:03 | 2025-02-26 19:35:03 | 5ms   | EOF        | root | internal        | tpch       | select 16     |
| dd97a36d2a1f4cbc-b23f13b975cd2dde | QUERY     | 2025-02-26 19:34:59 | 2025-02-26 19:34:59 | 6ms   | EOF        | root | internal        | tpch       | select 15     |
| af75095f7a7c4d9f-9422d04d0604f904 | QUERY     | 2025-02-26 19:34:56 | 2025-02-26 19:34:56 | 8ms   | EOF        | root | internal        | tpch       | select 14     |
| 2764a7aaf2cf446d-922b4c5b5f853788 | QUERY     | 2025-02-26 19:34:54 | 2025-02-26 19:34:54 | 10ms  | EOF        | root | internal        | tpch       | select 13     |
| bf15d7d96b9c4f6b-8e6fe4c40b077ae8 | QUERY     | 2025-02-26 19:34:53 | 2025-02-26 19:34:53 | 9ms   | EOF        | root | internal        | tpch       | select 12     |
| ebf2221627b0435e-9bafebbe46d7315d | QUERY     | 2025-02-26 19:34:51 | 2025-02-26 19:34:51 | 7ms   | EOF        | root | internal        | tpch       | select 11     |
| 3309a4c57f61471c-9c863f6bb72a146b | QUERY     | 2025-02-26 19:34:50 | 2025-02-26 19:34:50 | 10ms  | EOF        | root | internal        | tpch       | select 10     |
| cb764ed358f34312-a7c56cbf7f521761 | QUERY     | 2025-02-26 19:34:48 | 2025-02-26 19:34:48 | 10ms  | EOF        | root | internal        | tpch       | select 9      |
| 38878f3344b649ff-a69f1c8cd0dc1960 | QUERY     | 2025-02-26 19:34:46 | 2025-02-26 19:34:46 | 9ms   | EOF        | root | internal        | tpch       | select 8      |
| 1182dc4c8105407c-b77c50a993cc0cb1 | QUERY     | 2025-02-26 19:34:42 | 2025-02-26 19:34:42 | 14ms  | EOF        | root | internal        | tpch       | select 7      |
| 8596d808d2814e8d-aefbac7d30a599d1 | QUERY     | 2025-02-26 19:34:40 | 2025-02-26 19:34:40 | 31ms  | EOF        | root | internal        | tpch       | select 6      |
| 325a66e868844aa4-90fae17f3a98d3e6 | QUERY     | 2025-02-26 19:34:38 | 2025-02-26 19:34:38 | 40ms  | EOF        | root | internal        | tpch       | select 5      |
| e30d1166a2674393-997246e064a7674c | QUERY     | 2025-02-26 19:34:36 | 2025-02-26 19:34:36 | 19ms  | EOF        | root | internal        | tpch       | select 4      |
| 4dfb91db8b448db-a4eab023bc119cea  | QUERY     | 2025-02-26 19:34:33 | 2025-02-26 19:34:33 | 14ms  | EOF        | root | internal        | tpch       | select 3      |
| 1453559772434cda-b64c2eae47ce6424 | QUERY     | 2025-02-26 19:34:31 | 2025-02-26 19:34:31 | 10ms  | EOF        | root | internal        | tpch       | select 2      |
| cbf8bf829740488c-b6da653e391b13c6 | QUERY     | 2025-02-26 19:34:30 | 2025-02-26 19:34:30 | 20ms  | EOF        | root | internal        | tpch       | select 1      |
+-----------------------------------+-----------+---------------------+---------------------+-------+------------+------+-----------------+------------+---------------+
20 rows in set (0.00 sec)
随后可通过 curl 访问 HTTP 接口获取具体 Profile,例如获取 ID 为 f7efdc4c092d4b14-95e0f7f7783974d3 的 Profile:
curl -uroot: http://127.0.0.1:5937/api/profile/text?query_id=f7efdc4c092d4b14-95e0f7f7783974d3 > f7efdc4c092d4b14-95e0f7f7783974d3.profile
获得结果与 Web UI 一致:
> head f7efdc4c092d4b14-95e0f7f7783974d3.profile -n 10
Summary:
   - Profile ID: f7efdc4c092d4b14-95e0f7f7783974d3
   - Task Type: QUERY
   - Start Time: 2025-02-26 19:31:27
   - End Time: 2025-02-26 19:32:41
   - Total: 1min14sec
   - Task State: OK
   - User: root
   - Default Catalog: internal
   - Default Db: tpch
直接从磁盘里获取 Profile 文件
3.0 起,Profile 支持持久化,默认保存目录为 log/profile。若需更快查看,可直接使用 unzip 解压目标文件以获得文本格式。但需注意:
- Doris FE 对 log/profile 目录有保护,所以不要把 Profile 文件解压缩后的输出留在 log/profile 目录内,不然会被删除。
- Profile 文本与 Web UI 的展示略有不同:
Summary以 JSON 形式作为 meta 保存,后续部分与 Web UI 一致。
[hezhiqiang@VM-10-2-centos log]$ unzip profile/1740745121714_33bf38e988ea4945-b585d2f74d1da3fd.zip
Archive:  profile/1740745121714_33bf38e988ea4945-b585d2f74d1da3fd.zip
  inflating: 33bf38e988ea4945-b585d2f74d1da3fd.profile
[hezhiqiang@VM-10-2-centos log]$ head 33bf38e988ea4945-b585d2f74d1da3fd.profile -n 10
�{"summaryProfile":{"counterTotalTime":{"value":0,"type":5,"level":1},"localTimePercent":0.0,"infoStrings":{"Distributed Plan":"N/A","Task Type":"QUERY","User":"root","Default Catalog":"internal","Total":"9sec745ms","Default Db":"tpch","Profile ID":"33bf38e988ea4945-b585d2f74d1da3fd","Task State":"OK","Sql Statement":"SELECT      c.c_name,      COUNT(o.o_orderkey) AS total_orders,      SUM(o.o_totalprice) AS total_spent FROM      customer c JOIN      orders o ON c.c_custkey \u003d o.o_custkey GROUP BY      c.c_name limit 20","Start Time":"2025-02-28 20:18:31","End Time":"2025-02-28 20:18:41"},"infoStringsDisplayOrder":["Profile ID","Task Type","Start Time","End Time","Total","Task State","User","Default Catalog","Default Db","Sql Statement","Distributed Plan"],"counterMap":{"TotalTime":{"value":0,"type":5,"level":1}},"childCounterMap":{},"childMap":{},"childList":[],"planNodeInfos":[],"name":"Summary","timestamp":-1,"isDone":false,"isCancel":false,"isSinkOperator":false,"nodeid":-1},"executionSummaryProfile":{"counterTotalTime":{"value":0,"type":5,"level":1},"localTimePercent":0.0,"infoStrings":{"Fragment RPC Count":"2","Analysis Time":"6ms","CreateSingleNode Time":"N/A","Get Table Version Count":"N/A","Parse SQL Time":"3ms","Get Partition Files Time":"N/A","Get Partition Version Time":"N/A","Nereids Optimize Time":"11ms","Nereids Lock Table Time":"6ms","Get Partitions Time":"N/A","Get Table Version Time":"N/A","Nereids GarbageCollect Time":"0ms","Wait and Fetch Result Time":"9sec643ms","Is Nereids":"Yes","Is Cached":"No","Workload Group":"normal","Finalize Scan Node Time":"N/A","Fetch Result Time":"9sec641ms","Instances Num Per BE":"10.16.10.2:8261:4","Plan Time":"26ms","Fragment RPC Phase1 Time":"28ms","Create Scan Range Time":"N/A","Fragment Assign Time":"3ms","Nereids BeFoldConst Time":"0ms","JoinReorder Time":"N/A","QueryDistributed Time":"N/A","Get Splits Time":"N/A","Fragment Compressed Size":"22.63 KB","Get Partition Version Count":"N/A","Fragment RPC Phase2 Time":"30ms","Schedule Time Of BE":"{\"phase1\":{\"10.16.10.2: 8261\":{\"RPC Work Time\":\"17ms\",\"RPC Latency From FE To BE\":\"10ms\",\"RPC Work Queue Time\":\"0ms\",\"RPC Latency From BE To FE\":\"1ms\"}},\"phase2\":{\"10.16.10.2: 8261\":{\"RPC Work Time\":\"4ms\",\"RPC Latency From FE To BE\":\"3ms\",\"RPC Work Queue Time\":\"0ms\",\"RPC Latency From BE To FE\":\"23ms\"}}}","Get Partition Version Count (hasData)":"N/A","Fragment Serialize Time":"9ms","Init Scan Node Time":"N/A","Trace ID":"","Nereids Rewrite Time":"10ms","Schedule Time":"70ms","Transaction Commit Time":"N/A","Nereids Translate Time":"2ms","Parallel Fragment Exec Instance Num":"48","Total Instances Num":"4","Doris Version":"e021a6a015","Nereids Distribute Time":"6ms","Nereids Analysis Time":"3ms","Write Result Time":"0ms","System Message":"N/A","Executed By Frontend":"N/A"},"infoStringsDisplayOrder":["Parse SQL Time","Nereids Lock Table Time","Nereids Analysis Time","Nereids Rewrite Time","Nereids Optimize Time","Nereids Translate Time","Nereids Distribute Time","Workload Group","Analysis Time","Plan Time","JoinReorder Time","CreateSingleNode Time","QueryDistributed Time","Init Scan Node Time","Finalize Scan Node Time","Get Splits Time","Get Partitions Time","Get Partition Files Time","Create Scan Range Time","Get Partition Version Time","Get Partition Version Count (hasData)","Get Partition Version Count","Get Table Version Time","Get Table Version Count","Schedule Time","Fragment Assign Time","Fragment Serialize Time","Fragment RPC Phase1 Time","Fragment RPC Phase2 Time","Fragment Compressed Size","Fragment RPC Count","Schedule Time Of BE","Wait and Fetch Result Time","Fetch Result Time","Write Result Time","Doris Version","Is Nereids","Is Cached","Total Instances Num","Instances Num Per BE","Parallel Fragment Exec Instance Num","Trace ID","Transaction Commit Time","System Message","Executed By Frontend","Nereids GarbageCollect Time","Nereids BeFoldConst Time"],"counterMap":{"TotalTime":{"value":0,"type":5,"level":1}},"childCounterMap":{},"childMap":{},"childList":[],"planNodeInfos":[],"name":"Execution Summary","timestamp":-1,"isDone":false,"isCancel":false,"isSinkOperator":false,"nodeid":-1},"parseSqlStartTime":1740745111965,"parseSqlFinishTime":1740745111968,"nereidsLockTableFinishTime":1740745111971,"nereidsAnalysisFinishTime":1740745111974,"nereidsRewriteFinishTime":1740745111984,"nereidsOptimizeFinishTime":1740745111995,"nereidsTranslateFinishTime":1740745111997,"nereidsGarbageCollectionTime":0,"nereidsBeFoldConstTime":0,"queryBeginTime":1740745111968,"queryAnalysisFinishTime":1740745111974,"queryJoinReorderFinishTime":-1,"queryCreateSingleNodeFinishTime":-1,"queryDistributedFinishTime":-1,"initScanNodeStartTime":-1,"initScanNodeFinishTime":-1,"finalizeScanNodeStartTime":-1,"finalizeScanNodeFinishTime":-1,"getSplitsStartTime":-1,"getPartitionsFinishTime":-1,"getPartitionFilesFinishTime":-1,"getSplitsFinishTime":-1,"createScanRangeFinishTime":-1,"queryPlanFinishTime":1740745112000,"assignFragmentTime":1740745112003,"fragmentSerializeTime":1740745112012,"fragmentSendPhase1Time":1740745112040,"fragmentSendPhase2Time":1740745112070,"fragmentCompressedSize":23173,"fragmentRpcCount":2,"queryScheduleFinishTime":1740745112070,"queryFetchResultFinishTime":1740745121713,"tempStarTime":1740745121713,"queryFetchResultConsumeTime":9641,"queryWriteResultConsumeTime":0,"getPartitionVersionTime":0,"getPartitionVersionCount":0,"getPartitionVersionByHasDataCount":0,"getTableVersionTime":0,"getTableVersionCount":0,"transactionCommitBeginTime":-1,"transactionCommitEndTime":-1,"filesystemOptTime":-1,"hmsAddPartitionTime":-1,"hmsAddPartitionCnt":0,"hmsUpdatePartitionTime":-1,"hmsUpdatePartitionCnt":0,"filesystemRenameFileCnt":0,"filesystemRenameDirCnt":0,"filesystemDeleteDirCnt":0,"filesystemDeleteFileCnt":0,"transactionType":"UNKNOWN"}�U
Changed Session Variables:
VarName                       | CurrentValue | DefaultValue
------------------------------|--------------|-------------
insert_visible_timeout_ms     | 10000        | 60000
fetch_splits_max_wait_time_ms | 4000         | 1000
exec_mem_limit                | 2147483648   | 100147483648
profile_level                 | 2            | 1
auto_profile_threshold_ms     | 1            | -1
Profile 结构
Profile 内容整体分为以下几部分:
- Summary
SummaryProfile为 Profile 的元信息,记录用于检索的关键字段,如Profile ID、Total等。
-  Profile  ID:  d4d281168bf7490a-a133623295744f85
-  Task  Type:  QUERY
-  Start  Time:  2025-02-28  19:23:14
-  End  Time:  2025-02-28  19:23:16
-  Total:  2sec420ms
-  Task  State:  OK
- ExecutionSummary 为执行过程总结。其中与 Plan 相关的字段记录 Planner 的耗时。
- ChangedSessionVariables 记录该查询执行期间改动的 session 变量。
ChangedSessionVariables:
VarName                       | CurrentValue | DefaultValue
------------------------------|--------------|-------------
insert_visible_timeout_ms     | 10000        | 60000
fetch_splits_max_wait_time_ms | 4000         | 1000
exec_mem_limit                | 2147483648   | 100147483648
profile_level                 | 2            | 1
auto_profile_threshold_ms     | 1            | -1
上述表格说明该查询在执行前改动了 5 个 session 变量。
- MergedProfile
为
DetailProfile的聚合结果。MergedProfile 主要作用:
- 便于快速理解查询计划与 Pipeline 的结构。
Doris 查询计划具有 Query → Fragment → PlanNode 的层级结构;执行层以 Pipeline 为单位调度,每个 Pipeline 由一组 Operator 构成。查询计划到 Pipeline 之间存在转换,MergedProfile 能清晰展现该结构。稍后示例将说明如何据此复原查询计划与 Pipeline 流水线。
- 便于快速找到性能瓶颈的算子。
定位性能问题时,通常需确定具体的瓶颈算子。可先在 MergedProfile 中根据 DependencyWaitTime 找到耗时最大的算子,再在 DetailProfile 中查看其详细信息,进一步判断瓶颈。
- 便于对比数据倾斜。
MergedProfile 记录数据在算子之间的流动细节。对比 InputRows 与 RowsProduced 可判断不同 Backend 上的数据是否存在不均衡分布,数据分布不均常导致查询变慢或失败。
- DetailProfile
执行的详细细节。DetailProfile 记录查询中每个 Fragment、每条 Pipeline 的 PipelineTask 在所有 Backend 上的执行细节。通常在通过 MergedProfile 确认瓶颈点后,结合 DetailProfile 进行深入分析。
Profile 解读例子
下面以一个包含 Aggregation、Join 与 Scan 的典型查询为例说明 Profile 的解读方法。针对 TPCH 数据集的 customer 与 orders 做 JOIN,并对结果做聚合。SQL 如下:
SELECT c.c_name,
       Count(o.o_orderkey) AS total_orders,
       Sum(o.o_totalprice) AS total_spent
FROM   customer c
       JOIN orders o
         ON c.c_custkey = o.o_custkey
GROUP  BY c.c_name
LIMIT  20
为避免 Profile 过于冗长,我们限制查询并行度:
set parallel_pipeline_task_num=2;
执行上述查询并通过 Web UI 获取 Profile 后,先关注 MergedProfile。为专注整体结构,下文仅保留关键字段,其他字段含义可参考相关文档。
MergedProfile:
     Fragments:
       Fragment 0:
         Pipeline 0(instance_num=1):
           RESULT_SINK_OPERATOR(id=0):
             CommonCounters:
                - ExecTime: avg 176.545us, max 176.545us, min 176.545us
                - InputRows: sum 20, avg 20, max 20, min 20
                - WaitForDependency[RESULT_SINK_OPERATOR_DEPENDENCY]Time: avg 0ns, max 0ns, min 0ns
             CustomCounters:
           EXCHANGE_OPERATOR(id=8):
             CommonCounters:
                - ExecTime: avg 84.559us, max 84.559us, min 84.559us
                - RowsProduced: sum 20, avg 20, max 20, min 20
             CustomCounters:
                - WaitForDependencyTime: avg 0ns, max 0ns, min 0ns
                  - WaitForData0: avg 11sec450ms, max 11sec450ms, min 11sec450ms
       Fragment 1:
         Pipeline 0(instance_num=2):
           DATA_STREAM_SINK_OPERATOR(dest_id=8):
             CommonCounters:
                - ExecTime: avg 31.515us, max 33.405us, min 29.626us
                - InputRows: sum 20, avg 10, max 11, min 9
                - WaitForDependencyTime: avg 0ns, max 0ns, min 0ns
                  - WaitForRpcBufferQueue: avg 0ns, max 0ns, min 0ns
             CustomCounters:
                - BlocksProduced: sum 2, avg 1, max 1, min 1
           SORT_OPERATOR(nereids_id=443)(id=7):
             CommonCounters:
                - ExecTime: avg 980ns, max 1.199us, min 762ns
                - RowsProduced: sum 20, avg 10, max 11, min 9
                - WaitForDependency[SORT_OPERATOR_DEPENDENCY]Time: avg 11sec450ms, max 11sec450ms, min 11sec450ms
             CustomCounters:
         Pipeline 1(instance_num=2):
           SORT_SINK_OPERATOR(nereids_id=443)(id=7):
             CommonCounters:
                - ExecTime: avg 49.414us, max 54.802us, min 44.27us
                - InputRows: sum 20, avg 10, max 11, min 9
                - WaitForDependency[SORT_SINK_OPERATOR_DEPENDENCY]Time: avg 0ns, max 0ns, min 0ns
             CustomCounters:
           AGGREGATION_OPERATOR(nereids_id=438)(id=6):
             CommonCounters:
                - ExecTime: avg 34.521us, max 36.402us, min 32.640us
                - RowsProduced: sum 20, avg 10, max 11, min 9
                - WaitForDependency[AGGREGATION_OPERATOR_DEPENDENCY]Time: avg 11sec450ms, max 11sec450ms, min 11sec450ms
             CustomCounters:
         Pipeline 2(instance_num=2):
           AGGREGATION_SINK_OPERATOR(nereids_id=438)(id=6):
             CommonCounters:
                - ExecTime: avg 109.89us, max 118.582us, min 99.596us
                - InputRows: sum 40, avg 20, max 22, min 18z
                - WaitForDependency[AGGREGATION_SINK_OPERATOR_DEPENDENCY]Time: avg 0ns, max 0ns, min 0ns
             CustomCounters:
           EXCHANGE_OPERATOR(id=5):
             CommonCounters:
                - ExecTime: avg 29.741us, max 34.521us, min 24.962us
                - RowsProduced: sum 40, avg 20, max 22, min 18
             CustomCounters:
                - WaitForDependencyTime: avg 0ns, max 0ns, min 0ns
                  - WaitForData0: avg 11sec450ms, max 11sec450ms, min 11sec450ms
       Fragment 2:
         Pipeline 0(instance_num=2):
           DATA_STREAM_SINK_OPERATOR(dest_id=5):
             CommonCounters:
                - ExecTime: avg 71.148us, max 73.242us, min 69.54us
                - InputRows: sum 40, avg 20, max 20, min 20
                - WaitForDependencyTime: avg 0ns, max 0ns, min 0ns
                  - WaitForRpcBufferQueue: avg 0ns, max 0ns, min 0ns
             CustomCounters:
           AGGREGATION_OPERATOR(nereids_id=428)(id=4):
             CommonCounters:
                - ExecTime: avg 350.431us, max 393.100us, min 307.762us
                - RowsProduced: sum 40, avg 20, max 20, min 20
                - WaitForDependency[AGGREGATION_OPERATOR_DEPENDENCY]Time: avg 11sec30ms, max 11sec450ms, min 10sec610ms
             CustomCounters:
         Pipeline 1(instance_num=2):
           AGGREGATION_SINK_OPERATOR(nereids_id=428)(id=4):
             CommonCounters:
                - ExecTime: avg 442.308ms, max 449.109ms, min 435.506ms
                - InputRows: sum 150.0M (150000000), avg 75.0M (75000000), max 75.000001M (75000001), min 74.999999M (74999999)
                - MemoryUsage: sum 2.05 MB, avg 1.03 MB, max 1.03 MB, min 1.03 MB
                - MemoryUsagePeak: sum 2.05 MB, avg 1.03 MB, max 1.03 MB, min 1.03 MB
                - WaitForDependency[AGGREGATION_SINK_OPERATOR_DEPENDENCY]Time: avg 0ns, max 0ns, min 0ns
             CustomCounters:
                - MemoryUsageHashTable: sum 1.03 MB, avg 526.28 KB, max 526.28 KB, min 526.28 KB
                - MemoryUsageSerializeKeyArena: sum 1.02 MB, avg 524.00 KB, max 524.00 KB, min 524.00 KB
           HASH_JOIN_OPERATOR(nereids_id=418)(id=3):
             CommonCounters:
                - ExecTime: avg 9sec169ms, max 9sec582ms, min 8sec756ms
                - RowsProduced: sum 150.0M (150000000), avg 75.0M (75000000), max 75.000001M (75000001), min 74.999999M (74999999)
                - WaitForDependency[HASH_JOIN_OPERATOR_DEPENDENCY]Time: avg 949.860ms, max 962.978ms, min 936.743ms
             CustomCounters:
                - ProbeRows: sum 150.0M (150000000), avg 75.0M (75000000), max 75.000001M (75000001), min 74.999999M (74999999)
           OLAP_SCAN_OPERATOR(nereids_id=397. table_name=orders(orders))(id=2):
             CommonCounters:
                - ExecTime: avg 396.233ms, max 410.306ms, min 382.160ms
                - RowsProduced: sum 150.0M (150000000), avg 75.0M (75000000), max 75.000001M (75000001), min 74.999999M (74999999)
             CustomCounters:
                - WaitForDependency[OLAP_SCAN_OPERATOR_DEPENDENCY]Time: avg 0ns, max 0ns, min 0ns
         Pipeline 2(instance_num=2):
           HASH_JOIN_SINK_OPERATOR(nereids_id=418)(id=3):
             CommonCounters:
                - ExecTime: avg 445.146ms, max 890.258ms, min 34.635us
                - InputRows: sum 15.0M (15000000), avg 7.5M (7500000), max 15.0M (15000000), min 0
                - WaitForDependency[HASH_JOIN_SINK_OPERATOR_DEPENDENCY]Time: avg 482.355ms, max 964.711ms, min 0ns
             CustomCounters:
                - MemoryUsageHashTable: sum 185.22 MB, avg 92.61 MB, max 185.22 MB, min 0.00
           EXCHANGE_OPERATOR(id=1):
             CommonCounters:
                - ExecTime: avg 10.131ms, max 20.243ms, min 19.26us
                - RowsProduced: sum 15.0M (15000000), avg 7.5M (7500000), max 15.0M (15000000), min 0
             CustomCounters:
                - WaitForDependencyTime: avg 0ns, max 0ns, min 0ns
                  - WaitForData0: avg 47.582ms, max 47.582ms, min 47.582ms
       Fragment 3:
         Pipeline 0(instance_num=2):
           DATA_STREAM_SINK_OPERATOR(dest_id=1):
             CommonCounters:
                - ExecTime: avg 3.269ms, max 3.281ms, min 3.258ms
                - InputRows: sum 15.0M (15000000), avg 7.5M (7500000), max 7.500001M (7500001), min 7.499999M (7499999)
                - WaitForDependencyTime: avg 0ns, max 0ns, min 0ns
                  - WaitForLocalExchangeBuffer0: avg 142.859ms, max 285.713ms, min 6.733us
                  - WaitForRpcBufferQueue: avg 0ns, max 0ns, min 0ns
             CustomCounters:
           OLAP_SCAN_OPERATOR(nereids_id=403. table_name=customer(customer))(id=0):
             CommonCounters:
                - ExecTime: avg 77.435ms, max 78.752ms, min 76.118ms
                - RowsProduced: sum 15.0M (15000000), avg 7.5M (7500000), max 7.500001M (7500001), min 7.499999M (7499999)
             CustomCounters:
                - WaitForDependency[OLAP_SCAN_OPERATOR_DEPENDENCY]Time: avg 49.690ms, max 50.522ms, min 48.858ms
上面的是精简过的 MergedProfile。Doris 的查询计划有 Query - Fragment - PlanNode 的三级结构,而 Backend 上的执行引擎还会在此基础上再增加 Pipeline - Operator 两层。 我们先用一张图来说明上述查询从查询计划的角度来看如何分成三级。
Query & Fragment & PlanNode
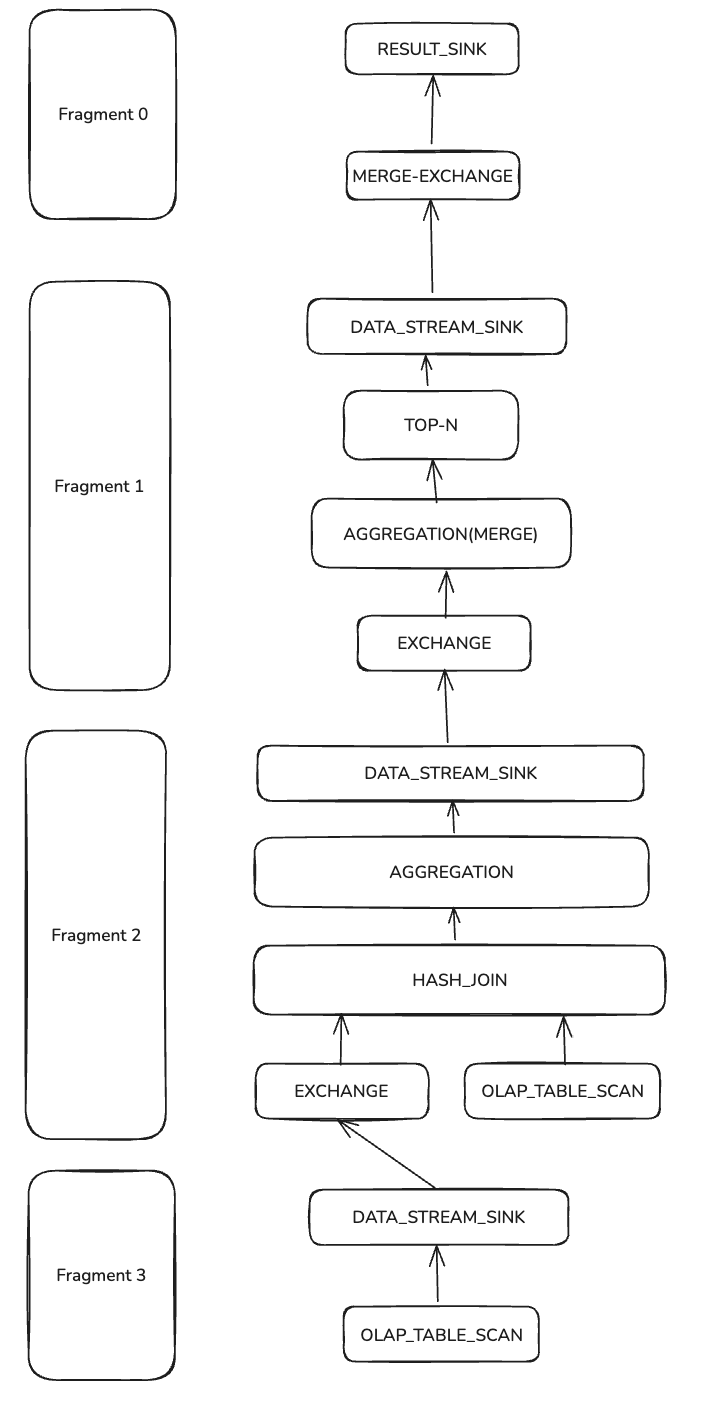
图中的箭头表示数据的流向。从上图可以看到整个 Query 的查询计划被分为了 4 个 Fragment(上图左侧的四个方块)和多个 PlanNode (Fragment 和属于他的 PlanNode 在同一个水平线上),PlanNode 中包含了两个 SCAN_NODE,分别读取 customer 和 orders 这两张表,多个 DATA_STREAM_SINK 和 EXCHANGE,用于在不同的 Fragment 之间传递数据,HASH_JOIN 用来对 SCAN 读上来的数据进行连接操作,聚合操作被分为了两阶段,第一阶段 AGGREGATION 和第二阶段 AGGREGATION(MERGE),RESULT_SINK 用于向 FE 返回结果,而在他之前还有个 TOP-N 算子,用来限制结果的行数。
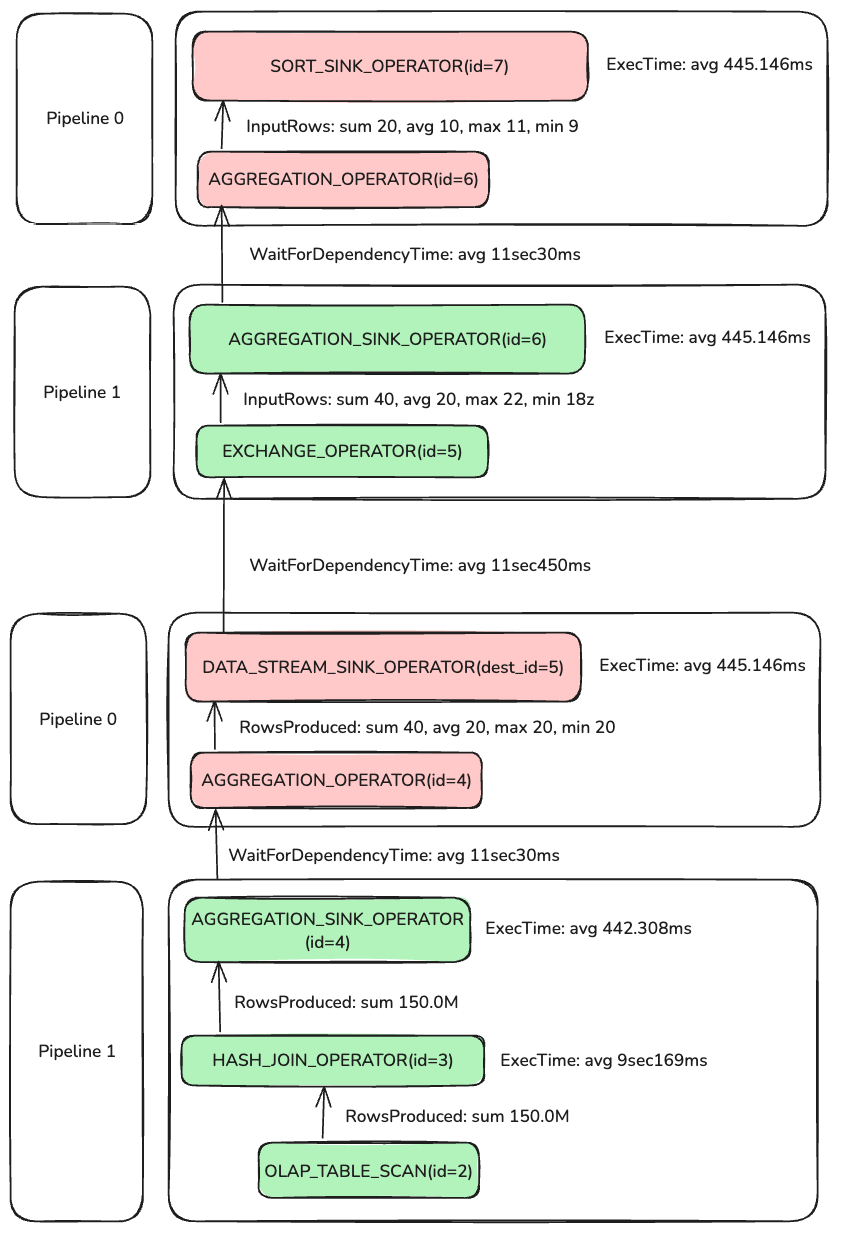
Pipeline & Operator
上述的 QueryPlan 如何转化为执行引擎的 Pipeline 与 Operator?我们以包含 AGGREGATION 与 HASH_JOIN 这两个算子的 Fragment 1 和 Fragment 2 为例。
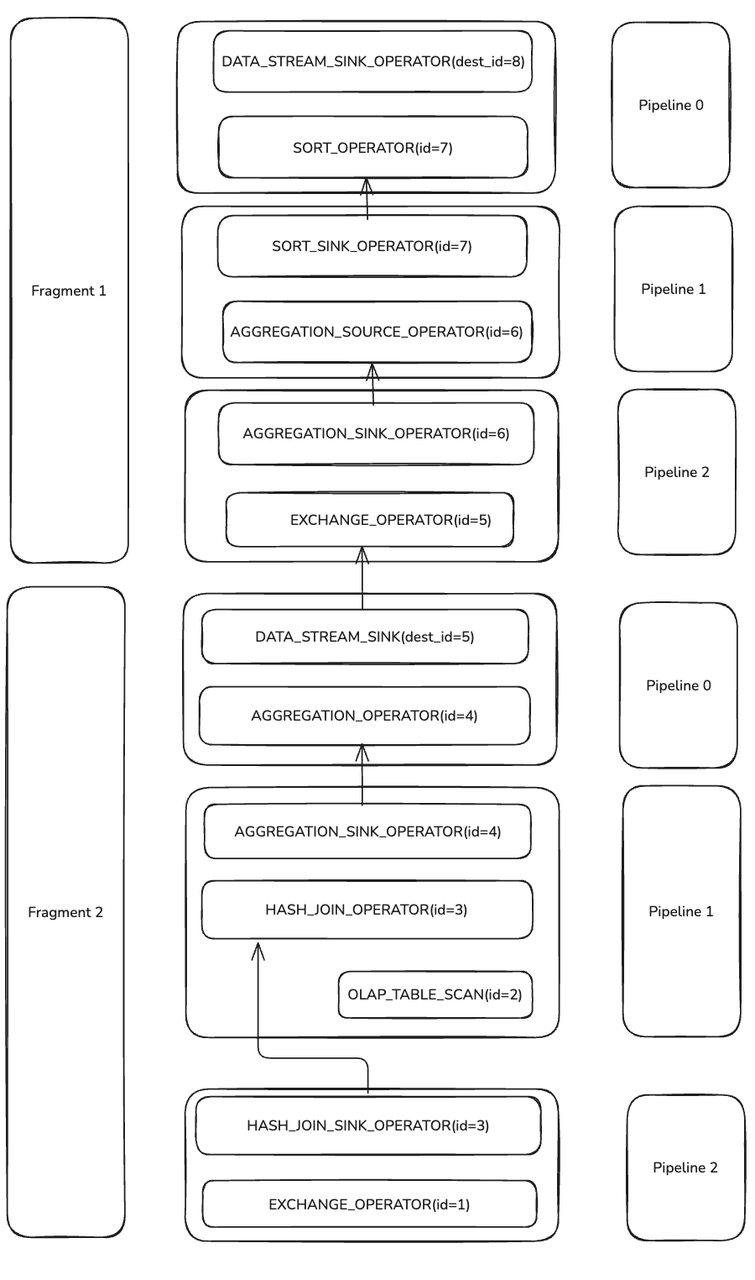
可以看到,Doris 的执行引擎在执行时会将一些 PlanNode 拆分成一个或者多个 Operator。
比如 DATA_STREAM_SINK 被转换成了一个 DATA_STREAM_SINK_OPERATOR,该节点是 Fragment 向外输出数据的算子,本身没有 OperatorId,只有他的目标 OperatorId,dest_id=5 表示该算子把数据发送到 id=5 的 EXCHANGE_OPERATOR。
PlanNodeId 等于 3 的 HASH_JOIN 就被拆成了两个 Operator,分别是 HASH_JOIN_SINK_OPERATOR 与 HASH_JOIN_OPERATOR,他俩的 Operator Id 都为 3,等于他们的 PlanNodeId。 第一阶段的 AGGREGATION 与 第二阶段的 AGGREGATION(MERGE) 也各自都被拆分成了一对 SINK 与 SORCE 算子。
当 PlanNode 被拆成 Operator 之后,执行引擎会把一些 Operator 连接起来组成 Pipeline,上图中可以看到,Fragment 1 与 Fragment 2 内部各自有 3 条 Pipeline。Pipeline 内部的算子之间的数据流动是不会阻塞的,相反,用于连接 Pipeline 的算子相互之间则有阻塞关系,这种阻塞关系包括有计算逻辑上的依赖导致的阻塞(比如 HashJoin 的 Probe 侧需要等待 HashJoin 的 Build 侧构建完 Hash 表才能执行)还包括计算机系统物理环境导致的阻塞(比如 EXCHANGE_OPERATOR 需要等待 DATA_STREAM_SINK_OPERATOR 通过网络把数据传输过来,天然形成阻塞)。
通过 Pipeline 把不阻塞的算子连接到一起调度执行可以使得资源利用率和缓存命中率更高。
CommonCounters & CustomCounters
CommonCounters 是所有的 Operator 都必须有的 Counter。目前 doris 中要求每个算子都必须有的 Counter 包含:
- ExecTime: 当前 Operator 执行花费的时间,注意不包括当前算子的上游算子的执行时间。
- RowsProduced(非SinkOperator): 除了SinkOperator 之外,所有的 Source 算子都有 RowsProduced,记录当前算子输出了多少行。
- InputRows(SinkOperator): 所有的 Sink 算子都有 InputRows,表示当前算子的输入是多少行。
- MemoryUsage & MemoryUsagePeak: 算子当前的内存使用量以及内存使用的峰值。
- WaitForDepencency: 等待它的依赖执行结束花费的时间。
CustomCounter 则是 Operator 特有的 Counter。参考文章 Doris算子Profile梳理,里面详细介绍了每个算子的 CustomCounter 的含义。
HashJoin
当我们梳理出来 Doris 执行时的基本概念之后,我们再回过头来看一下之前的查询,通过 MergedProfile 我们来复原一下 Join 的执行细节。
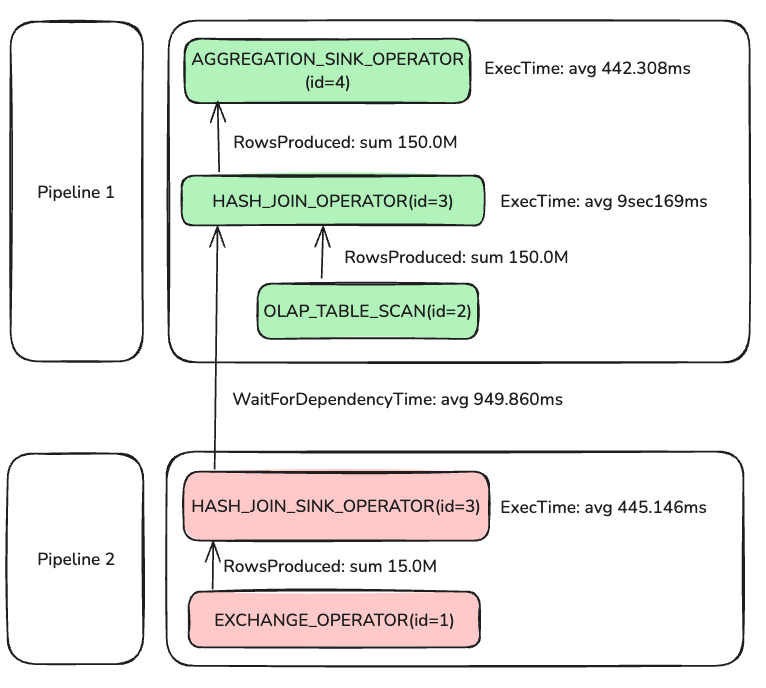
记住我们在执行 SQL 之前设置了查询 Pipeline 的并行度为 2,所以虽然上图中只显示了一组 连接的 Pipeline 1 和 Pipeline 2,但是在实际执行时他们应该是有 4 个 Pipeline Task,每条 Pipeline 都有两个 Pipeline Task。
Pipeline 0(instance_num=2)
每条 Pipeline 的后面有一个括号,括号内记录的 instance_num 等于该 Pipeline 在所有 BE 上的 PipelineTask 数量之和,我们构建的 集群只有 1 BE,所以这里看到的 instance_num 就等于 1 * parallel_pipeline_task_num = 2。
相同颜色的表示在同一条 Pipeline 内,Pipeline 2 的两个 PipelineTask 累计处理了 15M 行数据用于构建 HashTable,而构建 HashTable 这一步的平均执行时间是 445.146 ms。还记得前面提到的 Pipeline 的依赖关系么,Pipeline 1 的执行前提是 Pipeline 2 完成了构建 HashTable 的操作,而这里的的等待时间就反映在 WaitForDependency 上,avg 为 949.860 ms,但是构建 HashTable 的平均时间只有 445.146 ms,问题出在哪里?在这个 case 中,FE 规划的 JOIN 类型为 BROADCAST_JOIN,此时两个进行 JOIN Build 操作的 PipelineTask 中只会选一个来真正进行 BuildHash 表的操作
HASH_JOIN_SINK_OPERATOR(nereids_id=418)(id=3):
 CommonCounters:
    - ExecTime: avg 445.146ms, max 890.258ms, min 34.635us
    - InputRows: sum 15.0M (15000000), avg 7.5M (7500000), max 15.0M (15000000), min 0
    - WaitForDependency[HASH_JOIN_SINK_OPERATOR_DEPENDENCY]Time: avg 482.355ms, max 964.711ms, min 0ns
 CustomCounters:
    - MemoryUsageHashTable: sum 185.22 MB, avg 92.61 MB, max 185.22 MB, min 0.00
从 HASH_JOIN_SINK_OPERATOR 的 MergedProfile 中可以看到,并行度为 2 的 HASH_JOIN_SINK_OPERATOR 虽然平均执行时间为 445.146 ms,但是其中最慢的 PipelineTask 耗时是 890.258 ms,而最快的为 34.625 us,仔细看 InputRows 的分布,说明所有的数据都是一个 PipelineTask 处理的,另一个 PipelineTask 没有做事。因此
- WaitForDependency[HASH_JOIN_OPERATOR_DEPENDENCY]Time: avg 949.860ms, max 962.978ms, min 936.743ms
这里的时间也就说的通了。
继续看 HASH_JOIN_OPERATOR,它在等待了平均 949.860 ms后,开始执行 JOIN 的 Probe 侧,两个 id=2 的 OLAP_SCAN_OPERATOR 从存储中读出了 150M 行,这 150 M 被 HASH_JOIN_OPERATOR 算子处理之后,一行没剩下,全部往上给了 AGGREGATION_SINK_OPERATOR,该算子将会对这 150M 构建 HASH 表,继续进行聚合运算。
Aggregation
查询中涉及到的聚合操作是 Count(o.o_orderkey) AS total_orders, Sum(o.o_totalprice) AS total_spent 和 GROUP BY c.c_name
对于这个查询,Doris 使用两阶段的Aggregation。 第一阶段的 Aggregation 在 id=4 的一对 AGGREGATION 算子里完成,AGGREGATION_SINK_OPERATOR(id=4) 的输入一共是 150M 行,然后对 GROUP BY 列构建 Hash 表,同时更新每一个聚合结果的 AggregationData。 第一阶段结束后,把 AggregationData 通过 EXCHANGE 发送给第二阶段执行,第一阶段执行时不同的 PipelineTask 可能会处理相同的 GROUP BY 的 列,因此在 EXCHANGE 阶段会根据 name 列进行 HASH 分区后,把相同的 name 行发送到相同的 第二阶段的算子。 我们看到 AGGREGATION_OPERATOR(id=4)的输出一共是 40 行,说明我们在第一阶段构建的 Hash 表总共为 40 行。第二阶段的 AGGREGATION_SINK_OPERATOR(id=6) 把第一阶段的结果进行反序列化成 AggregationData,然后再进行 Merge 操作,结果由 AGGREGATION_OPERATOR(id=6) 发送给下游的 TOP-N,由于我们的查询带了 limit 20,当 TOP-N算子收集到 20 行数据后就提前结束了本次执行。
整体来看,本次查询最耗时的操作是在 HASH_JOIN_OPERATOR(id=3),定位到这里后,我们可以继续看 DetailProfile 中 HASH_JOIN_OPERATOR(id=3) 的更细粒度的 Counter。关于更细粒度的 Counter 可以参考每个算子的文档,详细解释了每个Counter的含义。